Predicting The Past With Greater And Greater Accuracy
The advance estimate of 1Q19 GDP growth will arrive on Friday (April 26). There’s always a lot of uncertainty in the advance figure (we’re missing a number of components) and that is especially so this time. The partial government shutdown and poor weather had an adverse impact. A narrower trade deficit should add to the growth estimate, but underlying domestic demand was likely moderate. The details of the report, and subsequent revisions, will help to gauge the underlying strength of the economy in 2Q19 and the rest of the year.
“If we could first know where we are, and whither we are tending, we could then better judge what to do, and how to do it.” — Abraham Lincoln
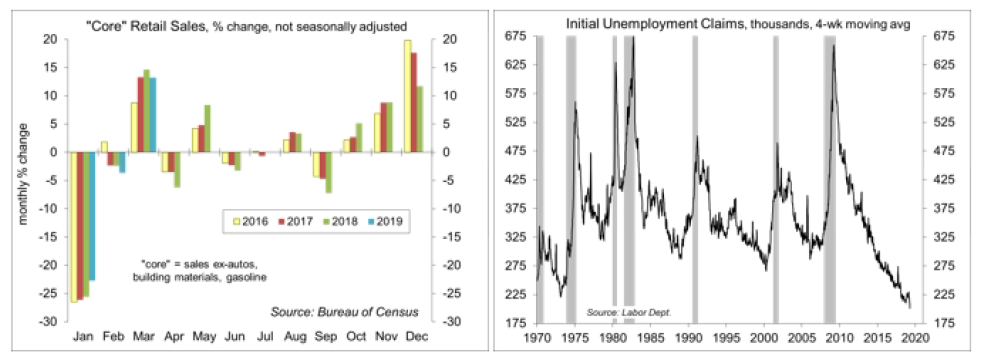
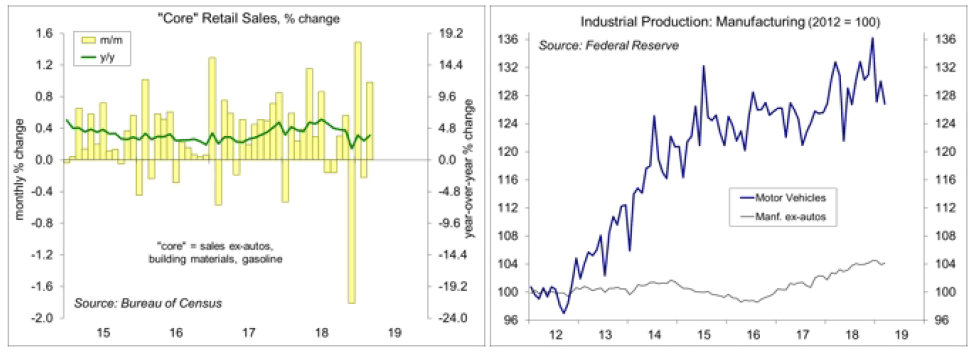
The partial government shutdown led to the delay of a number of economic data releases. At this point, we only have January consumer spending data, which is subject to revision (consumer spending accounts for 68% of Gross Domestic Product). Retail sales results, which make up about a quarter of overall consumer spending, may give us a good idea about spending in February and March, but are an imperfect indicator. The March retail sales figures surprised to the upside, but still haven’t made up for the unexpected weakness in December. These data are adjusted for floating holidays, such as Easter, but it’s difficult to get that right. Looking through the noise, the weather, and the government shutdown, the underlying trend appears moderate – not particularly strong, but not terribly weak either.
A strong job market is expected to support consumer spending growth in the near term. Weekly jobless claims have fallen to nearly a 50-year low. That could reflect seasonal adjustment issues (the late Easter) or eligibility issues (which vary by state). Corporate layoff announcements have been trending somewhat higher. However, those totals do not measure actual layoffs. Moreover, in a strong labor market, someone newly laid off is more likely to find another job more quickly – and therefore, is less likely to file a claim for unemployment insurance. Job growth should remain strong in the near term. However, the Fed’s most recent Beige Book, the anecdotal summary of economic conditions from around the country, showed that the tight job market was restraining the rate of growth” in some areas. Wage growth has picked up, but it remains relatively moderate compared to past periods of low unemployment. Firms continue to pull out all the stops to attract new workers, including offering signing bonuses, increased vacation, and other perks – but generally remain reluctant to lift wages for their existing employees. Gasoline prices have risen (much more than usual for this time of year), reducing consumer purchasing power in the near term.
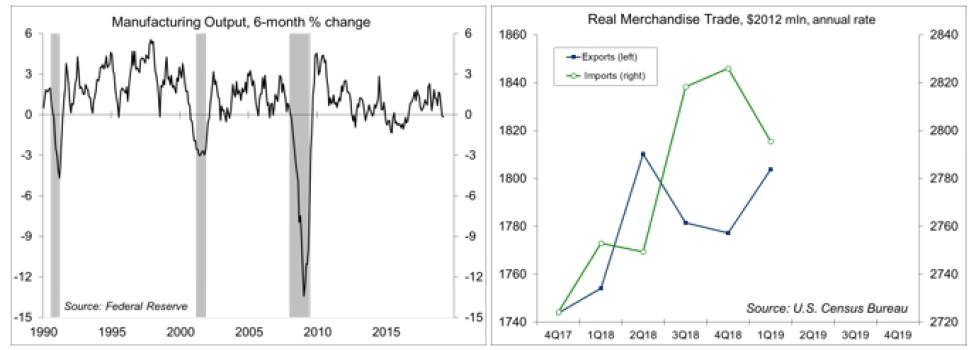
Meanwhile, factory output has been soft in recent months. Some of that likely reflects a pullback from strength in manufacturing activity in previous months. However, the slowdown is also consistent with a softer global economy, a lackluster trend in capital goods orders, and trade policy disruptions. Weakness in manufacturing production has traditionally been an indicator of recession, but an imperfect one, often giving false signals in the past. The factory sector has accounted for a decreasing share of the U.S. economy – a trend that goes back decades. The recent soft patch is nothing to worry about, but is consistent with a slower trend rate of growth in the overall economy in the near term.
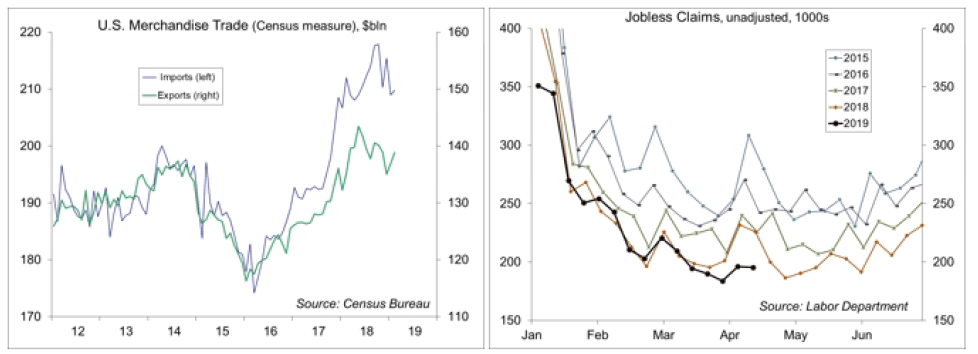
One of the big surprises in last week’s economic data releases was the unexpected narrowing in the trade deficit. Trade policy has been disruptive. Imports of supplies and materials picked up in the second half of 2018 ahead of expected increases in tariffs. In turn, imports softened in 1Q19. We only have figures for January and February, so there is some uncertainty. Imports have a negative sign in the GDP calculation. When the U.S. economy is strong, we consume more domestic goods and we consume more imported goods. The increase in imports subtracts from headline GDP growth. Exports increased in January and February. Adjusted for inflation, net exports ought to make a sizable contribution to 1Q19 GDP growth, perhaps a full percentage point or more (note that net exports added 2.0 percentage points to 3Q18 GDP growth).
Foreign trade and the change in inventories are relatively small components of GDP, but they account for more than their fair share of volatility in the quarterly figures. Swings in defense spending can also add volatility. Financial market participants typically concentrate on the headline GDP figure, but if we are interested in the economy’s underlying strength, we should focus on Private Domestic Final Purchases (PDFP). PDFP can be thought of as GDP less government, the change in inventories, and foreign trade. It’s also consumer spending, business fixed investment, and residential fixed investment (mostly homebuilding) – the real meat and potatoes of the economy and is much less volatile from quarter to quarter. PDFP is likely to have risen at a lackluster-to-moderate pace in 1Q19, but should pick up in the second quarter.
Data Recap – The economic data reports were mixed, but consistent with moderately strong growth in the near term.
The Fed’s Beige Book noted that economic activity expanded at a “slight-to-moderate” pace in March and early April, although “a few Fed districts reported some strengthening.” Reports on consumer spending were mixed but suggested “sluggish sales for both general retailers and auto dealers.” Reports on manufacturing activity were “favorable,” although “contacts in many districts noted trade-related uncertainty.” Job growth was modest to moderate across most regions, with increases “most highly concentrated in high-skilled jobs.” Labor markets “remained tight, restraining the rate of growth.” The tight job market “also led to continued wage pressures,” while “firms have offered perks such as bonuses and expanded benefits packages in order to attract and retain employees.” Still, “most Districts reported moderate wage growth” and “wages for both skilled and unskilled positions generally grew at about the same pace as earlier this year.” On balance, “prices have risen modestly.” Tariffs, freight costs, and rising wages added to input costs. However, “the ability of firms to pass increased input costs on to consumers was mixed.”
Retail Sales jumped 1.6% in March (+3.6% y/y), reflecting a rebound from the partial government shutdown and poor weather. The 1Q19 pace was up at a 0.2% annual rate (vs. +1.0% in 4Q18). Auto dealership sales rose 1.2% (+3.6% y/y), consistent with the gain in unit auto sales figures reported by the various automakers (reflecting clearance promotions). Ex-autos, sales rose 1.2% (+3.6% y/y).
Industrial Production edged down 0.1% in the initial estimate for March (+2.8% y/y). Manufacturing output was flat, down at a 1.0% annual rate in 1Q19 (+2.6% y/y). Production of motor vehicles and parts fell 2.5%, down at a 12.8% annual rate in 1Q19 (although 5.5% above 1Q18). Ex-autos, factory output rose 0.2%, a -0.1% annual rate in 1Q19 (2.0% above 1Q18). Results were mixed across sectors.
The U.S. Trade Deficit narrowed unexpectedly, to $49.4 billion in February, vs. $51.1 billion in January (unrevised) and $59.9 billion in December. Merchandise imports rose 0.4% (-1.0% y/y), boosted by a 4.9% gain in petroleum imports (reflecting higher prices, the quantity of petroleum imports fell 4.9%). Ex-petroleum, imports edged up 0.1% (+0.6% y/y). There is some evidence of stockpiling ahead of expected tariff increases. Imports of industrial supplies and materials fell 9.8% y/y, vs. +23.8% y/y in July. Merchandise exports rose 1.5% (+2.6% y/y). Adjusted for inflation, the trade deficit narrowed sharply in the first two months of 1Q19, vs. a sharp widening over the two previous quarters. As a consequence, net exports are likely to add to 1Q19 GDP growth, after subtracting in 3Q18 and 4Q18.
Jobless Claims fell further in the week ending April 13, to 192,000 – the lowest level since September 6, 1969. The four-week average edged down to 201,250 – the lowest level since November 1, 1969. Recent figures may be artificially low due to seasonal adjustment issues (the late Easter). Note that announced corporate layoffs, while still low, have been trending higher. The low level of weekly claims could signal eligibility issues, but in a strong job market it’s more likely that someone laid off will transition to a new job (than file a claim).
Business Inventories rose 0.3% in the initial estimate for February, up 4.3% y/y. Retail inventories, the only new information in this report, rose 0.3% (autos +0.3%, ex-autos +0.4%). Manufacturing inventories rose 0.3% and wholesale inventories rose 0.2%. These figures are not adjusted for price changes (for example, petroleum prices). Through the first two months of 1Q19, the pace of inventory growth appears faster than in 4Q18, but part of that is higher petroleum prices. Business sales (factory shipments plus wholesale and retail sales) rose 0.1% in February, up 2.4% y/y.
The Index of Leading Economic Indicators rose 0.4% in March, as expected, following a flat trend over the previous five months. Positive contributions were led by lower jobless claims, increased consumer expectations, the stock market, and credit. There were no negative contributions. The Index of Coincident Economic Indicators edged up 0.1%. The report noted that “taken together, the current behavior of the composite indexes and their components suggest that the expansion in economic activity should continue, but the pace of growth is likely to decelerate by year end.”
Homebuilder Sentiment edged up to 63 in April, vs. 62 in both February and March (up from 58 in January and 56 in December). The release indicated that “builders report solid demand for new single-family homes, but they are also grappling with affordability concerns stemming from a chronic shortage of construction workers and buildable lots.”
The opinions offered by Dr. Brown should be considered a part of your overall decision-making process. For more information about this report – to discuss how this outlook may affect your personal situation and/or to learn how this insight may be incorporated into your investment strategy – please contact your financial advisor or use the convenient Office Locator to find our office(s) nearest you today.
All expressions of opinion reflect the judgment of the Research Department of Raymond James & Associates (RJA) at this date and are subject to change. Information has been obtained from sources considered reliable, but we do not guarantee that the foregoing report is accurate or complete. Other departments of RJA may have information which is not available to the Research Department about companies mentioned in this report. RJA or its affiliates may execute transactions in the securities mentioned in this report which may not be consistent with the report’s conclusions. RJA may perform investment banking or other services for, or solicit investment banking business from, any company mentioned in this report. For institutional clients of the European Economic Area (EEA): This document (and any attachments or exhibits hereto) is intended only for EEA Institutional Clients or others to whom it may lawfully be submitted. There is no assurance that any of the trends mentioned will continue in the future. Past performance is not indicative of future results.


