
Down with the Sickness
The Wuhan coronavirus (COVID-19) has remained a key concern for the financial markets. Unfortunately, there is continued uncertainty regarding how wide the virus will spread and how sharp the economic impact will be. China accounted for nearly a third of global growth in the last two years. While the virus will have an impact on the U.S. economy, it appears unlikely to be enough to push us into a recession. However, the yield curve has inverted again, reigniting fears of recession and likely putting the Fed back in play.
The most direct economic impact of COVID-19 is through the disruption of supply changes, reduced sales into China, and the loss in travel and tourism. As we saw through the trade conflict last year, supply chains are complex and widespread. To some extent, U.S. manufacturing supply chains have migrated away from China to Vietnam, Thailand, and Mexico due to the trade war. However, much has remained in China. Moreover, one doesn’t always know who’s supplying your supplier. It often takes a major disruptions to discover where the bottlenecks are (so much for just-in-time manufacturing!). Motor vehicle production in Japan and South Korea has been curtailed due to supply shortages. Last week, Apple cited the coronavirus in cutting its sales expectations for the current quarter. Chinese tourism has grown significantly in recent years, accounting for about a fifth of global travel. Travel within China has fallen sharply, with flights into and out of the country at a fraction of previous levels.
In general and across a wide range of incomes, individual Chinese have a high savings rate. Amid restrictions (tens of millions can’t go shopping or out to restaurants), spending has dropped sharply. Efforts to support lending ought to limit the damage and, more importantly, support the eventual recovery. We should see activity improve once the virus is contained. However, it seems likely that a full recovery will take months, rather than weeks.
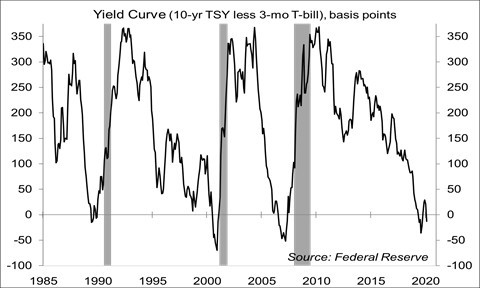
In the meantime, uncertainty remains high. Gauging the timing and extent of economic damage will be difficult. A global flight to safety has pushed long-term interest rates down in the U.S., inverting the yield curve once again. The 10-year Treasury note yield less the 3-month bill rate has dropped to -13 basis points. Using a simple yield-curve model of recession, that’s equivalent to about a 32% chance of entering a recession within the next 12 months (vs. 25% in January and nearly 40% back in August). Yes, U.S. bond yields have seen downward pressure from low yields outside the U.S. However, “this time is different” is a phrase one hears every time the yield curve inverts. As we saw last summer, an inverted yield curve and recession fears are having a negative effect on the stock market – and a falling stock market further raises concerns about a possible recession.
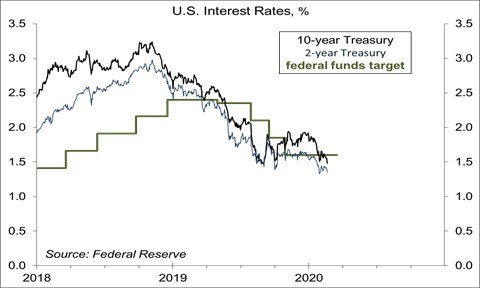
There is a simple way for the Fed to steepen the yield curve. It can cut short-term interest rates. At present, the Fed has given no signal that a move is likely. In his February 11 testimony to Congress, Chair Powell stated that “the FOMC believes that the current stance of monetary policy will support continued economic growth, a strong labor market, and inflation returning to the Committee’s symmetric 2 percent objective.” Moreover, “as long as incoming information about the economy remains broadly consistent with this outlook, the current stance of monetary policy will likely remain appropriate.” Of course, “policy is not on a preset course. If developments emerge that cause a material reassessment of our outlook, we would respond accordingly.” The level of short-term interest rates is already pretty accommodative, and much of the U.S. economy appears to be in good shape. Weakness in manufacturing and business fixed investment is moderate – not the kind of decline one sees in a recession. However, the Fed could move to address downside risks, as it did three times in 2019. Given how close the federal funds target range is to zero, the Fed should be more aggressive in cutting rates than it would be otherwise, moving sooner and in larger steps (although that wasn’t the case in the three “insurance” moves in 2019).
At the January 28-29 FOMC meeting, the coronavirus was only recently in the news. The Fed’s view at that time was that “the threat of the coronavirus, in addition to its human toll, had emerged as a new risk to the global growth outlook, which participants agreed warranted close watching.”
The federal funds futures market is currently pricing in a 60% chance that we’ll see a rate cut by June (these market-based probability measures are volatile). M20-2962934
Data Recap – China once again changed its reporting criteria for the coronavirus. Financial markets shifted from worries about the economic impact to hope that activity will rebound and back then again. The FOMC minutes added little color to the outlook for short-term interest rates. Residential construction figures were stronger than anticipated. The LEI popped, offsetting the five-month decline.
The FOMC Minutes from the January 18-29 policy meeting noted that “participants generally judged that the current stance of monetary policy was appropriate” to support growth in economic activity, strong labor market conditions, and a return of inflation to 2%. Several Fed officials were in favor of an asymmetric operational range around the 2% inflation goal (that is, allowing inflation above 2% for a while, in order to better achieve the 2% long-term goal). However, no decisions on this were expected until mid-year. The Fed expected to gradually remove support from the repo market, phasing it out after the April tax season. In late January, the Fed’s view was that “the threat of the coronavirus, in addition to its human toll, had emerged as a new risk to the global growth outlook, which participants agreed warranted close watching.”
The Producer Price Index rose 0.5% in January (+2.1% y/y), reflecting an increase in iron and steel scrap and less seasonal discounting in apparel. Ex-food, energy, and trade services, the PPI rose 0.4% (+1.5% y/y). Food rose 0.2% (+2.7% y/y). Wholesale gasoline prices fell 1.5% (-0.2% before seasonal adjustment, +23.1% y/y). Iron and steel scrap rose 13.9% (-11.1% y/y). Ex-food & energy, the PPI for consumer goods was unchanged (+0.4% before seasonal adjustment, +1.3% y/y). Services rose 0.7% (+2.0%), with 40% of that increase due to a 10.3% jump in margins for apparel, jewelry, footwear, and accessories retailing.
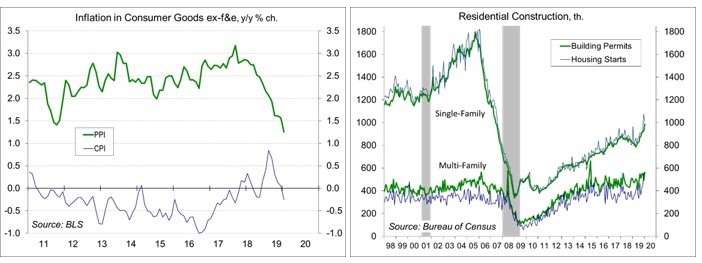
Building Permits rose 9.2% in January, to a 1.551 million seasonally adjusted annual rate (+17.9% y/y). Single-family permits rose 6.4% (+20.2% y/y) to the highest level since 2007. Unadjusted single-family permits for November-January rose 11.8% y/y (+6.4% in the Northeast, +13.7% in the Midwest, +13.5% in the South, and +18.5% in the West). Housing Starts fell 3.6%, to a 1.567 million pace (+21.4% y/y).
Homebuilder Sentiment edged down 1 point to 74 in February. Affordability remains an issue, as price increases have offset the impact of low mortgage rates.
Existing Home Sales slipped 1.3% in January, to a 5.46 million seasonally adjusted annual rate (+9.6% y/y). The National Association of Realtors noted continued supply constraints.
The Conference Board’s Index of Leading Economic Indicators jumped 0.8% in January, vs. a 0.7% decline from July to December. Positive contributions in January were led by the drop in jobless claims, increased building permits, and the stock market. The only negative contribution came from ISM New Orders.
The opinions offered by Dr. Brown should be considered a part of your overall decision-making process. For more information about this report – to discuss how this outlook may affect your personal situation and/or to learn how this insight may be incorporated into your investment strategy – please contact your financial advisor or use the convenient Office Locator to find our office(s) nearest you today.
All expressions of opinion reflect the judgment of the Research Department of Raymond James & Associates (RJA) at this date and are subject to change. Information has been obtained from sources considered reliable, but we do not guarantee that the foregoing report is accurate or complete. Other departments of RJA may have information which is not available to the Research Department about companies mentioned in this report. RJA or its affiliates may execute transactions in the securities mentioned in this report which may not be consistent with the report’s conclusions. RJA may perform investment banking or other services for, or solicit investment banking business from, any company mentioned in this report. For institutional clients of the European Economic Area (EEA): This document (and any attachments or exhibits hereto) is intended only for EEA Institutional Clients or others to whom it may lawfully be submitted. There is no assurance that any of the trends mentioned will continue in the future. Past performance is not indicative of future results.