
Weekly Market Snapshot
Chief Economist Scott Brown discusses the latest market data.
The anticipated Blue Wave was apparently met by a Red Wave, leading to a closer-than-expected presidential election and a divided Congress. The stock market was encouraged by the prospects of a divided government, even though that implies a smaller fiscal package than we would have seen under a Democratic sweep (also no major tax increases). Bond yields fell in anticipation of less government borrowing.
Nonfarm payrolls rose by 638,000 in the initial estimate for October, restrained by a loss of temporary census workers and fewer teachers. Private-sector payrolls advanced by 906,000, with strength in manufacturing, construction and retail, plus a further recovery in restaurant jobs. However, payrolls remained more than 10 million lower (-6.6%) than in February. The ISM Manufacturing Index was stronger than expected in October, with robust growth in new orders and production. The ISM Services Index edged lower, but remained consistent with further improvement in the overall economy. Comments from supply managers in both reports were mixed, but generally positive, with ongoing concerns about the pandemic.
Next week: The bond market will be closed for the Veterans Day holiday on Wednesday. The Consumer Price Index is likely to rise moderately in October. Pandemic-related pipeline pressures are expected to be offset by more moderate shelter cost increases. Prices of used motor vehicles could also ease back, following strong gains over the three previous months.
Indices
| Last | Last Week | YTD return % | |
|---|---|---|---|
| DJIA | 28390.18 | 26659.11 | -0.52% |
| NASDAQ | 11890.93 | 11185.59 | 32.52% |
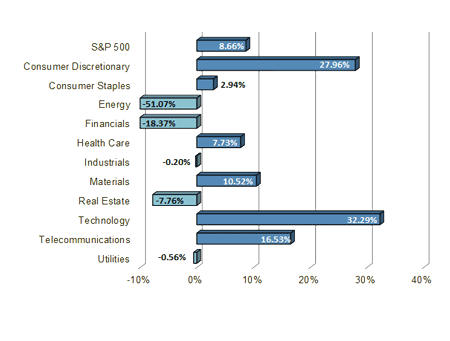
| S&P 500 | 3510.45 | 3310.11 | 8.66% |
| MSCI EAFE | 1916.22 | 1789.64 | -5.93% |
| Russell 2000 | 1660.05 | 1561.58 | -0.50% |
Consumer Money Rates
| Last | 1 year ago | |
|---|---|---|
| Prime Rate | 3.25 | 4.75 |
| Fed Funds | 0.08 | 1.54 |
| 30-year mortgage | 2.88 | 3.85 |
Currencies
| Last | 1 year ago | |
|---|---|---|
| Dollars per British Pound | 1.3148 | 1.286 |
| Dollars per Euro | 1.1826 | 1.107 |
| Japanese Yen per Dollar | 103.49 | 108.980 |
| Canadian Dollars per Dollar | 1.305 | 1.318 |
| Mexican Peso per Dollar | 20.707 | 19.145 |
Commodities
| Last | 1 year ago | |
|---|---|---|
| Crude Oil | 38.79 | 56.35 |
| Gold | 1946.80 | 1493.10 |
Bond Rates
| Last | 1 month ago | |
|---|---|---|
| 2-year treasury | 0.15 | 0.15 |
| 10-year treasury | 0.80 | 0.77 |
| 10-year municipal (TEY) | 1.28 | 1.43 |
Bond Rates
| Last | 1 month ago | |
|---|---|---|
| 2-year treasury | 0.16 | 0.13 |
| 10-year treasury | 0.86 | 0.65 |
| 10-year municipal (TEY) | 1.46 | 1.26 |
Treasury Yield Curve – 11/06/2020
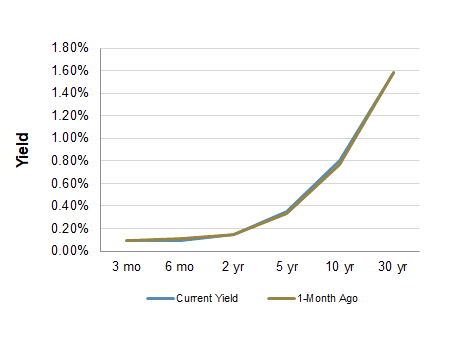
As of close of business 11/05/2020
S&P Sector Performance (YTD) – 11/06/2020
Economic Calendar
| November 11 | — | Veterans Day (bond market closed) |
| November 12 | — | Jobless Claims (week ending November 7) |
| — | Consumer Price Index (October) | |
| November 13 | — | Producer Price Index (October) |
| — | UM Consumer Sentiment (mid-November) | |
| November 17 | — | Retail Sales (October) |
| — | Industrial Production (October) | |
| November 18 | — | Building Permits, Housing Starts (October) |
| November 26 | — | Thanksgiving Holiday (markets closed) |
| December 4 | — | Employment Report (November) |
| December 16 | — | FOMC Policy Decision |
All expressions of opinion reflect the judgment of the Research Department of Raymond James & Associates, Inc. and are subject to change. There is no assurance any of the forecasts mentioned will occur or that any trends mentioned will continue in the future. Investing involves risks including the possible loss of capital. Past performance is not a guarantee of future results. International investing is subject to additional risks such as currency fluctuations, different financial accounting standards by country, and possible political and economic risks, which may be greater in emerging markets. While interest on municipal bonds is generally exempt from federal income tax, it may be subject to the federal alternative minimum tax, and state or local taxes. In addition, certain municipal bonds (such as Build America Bonds) are issued without a federal tax exemption, which subjects the related interest income to federal income tax. Municipal bonds may be subject to capital gains taxes if sold or redeemed at a profit. Taxable Equivalent Yield (TEY) assumes a 35% tax rate.
The Dow Jones Industrial Average is an unmanaged index of 30 widely held stocks. The NASDAQ Composite Index is an unmanaged index of all common stocks listed on the NASDAQ National Stock Market. The S&P 500 is an unmanaged index of 500 widely held stocks. The MSCI EAFE (Europe, Australia, Far East) index is an unmanaged index that is generally considered representative of the international stock market. The Russell 2000 index is an unmanaged index of small cap securities which generally involve greater risks. An investment cannot be made directly in these indexes. The performance noted does not include fees or charges, which would reduce an investor’s returns. U.S. government bonds and treasury bills are guaranteed by the US government and, if held to maturity, offer a fixed rate of return and guaranteed principal value. U.S. government bonds are issued and guaranteed as to the timely payment of principal and interest by the federal government. Treasury bills are certificates reflecting short-term (less than one year) obligations of the U.S. government.
Commodities trading is generally considered speculative because of the significant potential for investment loss. Markets for commodities are likely to be volatile and there may be sharp price fluctuations even during periods when prices overall are rising. Specific sector investing can be subject to different and greater risks than more diversified investments. Gross Domestic Product (GDP) is the annual total market value of all final goods and services produced domestically by the U.S. The federal funds rate (“Fed Funds”) is the interest rate at which banks and credit unions lend reserve balances to other depository institutions overnight. The prime rate is the underlying index for most credit cards, home equity loans and lines of credit, auto loans, and personal loans. Material prepared by Raymond James for use by financial advisors. Data source: Bloomberg, as of close of business November 5, 2020.