
The July Employment Report
Chief Economist Scott Brown discusses current economic conditions.
Nonfarm payrolls fell by 133,000 in July… before seasonal adjustment. Adjusted, payrolls rose by 943,000, following a 938,000 gain in June, partly reflecting a seasonal quirk in education. Ex-the artificial boost in education, payrolls advanced by 672,000 in July, following 668,000 in June, still very strong (but not quite as stellar as the headline payroll number would suggest). The unemployment rate fell to 5.4% (from 5.9%), even as labor force participation edged higher. The report, while encouraging, does not answer a couple of key questions. Will payrolls return to the pre-pandemic trend? If not, how will that affect the economic outlook? How will the Federal Reserve respond?
Education jobs are seasonal. In the latest school year, hiring was reduced due to the pandemic. As a result, fewer education jobs were lost in June and July. Unadjusted, education (public and private) shed 614,000 workers in June and 1.007 million in July. Adjusted, we added 270,000 in June and July – down 580,000 (or 4.0%) from February 2020.
Outside of education, payroll growth was still strong in June (+668,000) and July (+672,000). Overall, payrolls are down 5.7 million (-3.7%) from the pre-pandemic level. However, we would have likely added 2.8 million jobs if not for the COVID-19, leaving us about 8.5 million (5.5%) below the pre-pandemic trend. We still have a long way to go.
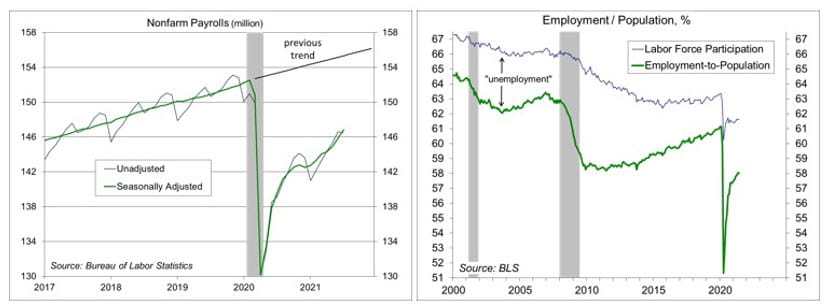
The unemployment rate fell to 5.4% in July, from 5.9% in June and 5.8% in May (and 10.2% a year ago). Labor force participation edged higher (61.7%, vs. 61.5% a year ago and 63.3% before the pandemic). Participation has been held down by early retirements during the pandemic, dependent care issues, and ongoing fear of the virus (and new variants). States that have reduced unemployment assistance have not seen relief in hiring difficulties. Anecdotal stories suggest that many of the unemployed have been re-evaluating life choices, and are reluctant to return to crummy jobs with crummy pay. Firms that have offered more pay and additional benefits have had more success in hiring.
It seems unlikely that the employment/population ratio (58.4% in July, vs. 55.2% a year ago) will return to its pre-pandemic level (61.1%) anytime soon. Equivalently, payrolls are unlikely to get back to the pre-pandemic trend. GDP growth is labor input plus productivity growth. Payroll growth will eventually slow to a pace more consistent with the growth in the working-age population (0.5% per year unless we significantly boost immigration). Productivity growth might increase with technology (artificial intelligence, etc.), but a scarcity of labor should lead to a reallocation if labor to its greater use. Granted, much of this is a long way off.
In the near term, there is a lot of uncertainty about the pace of job gains and overall growth over the next several months. The delta variant may be a short-term constraint, but there are increased concerns as the school year begins. The Fed can afford to be patient, but officials will differ on the perceived risk to growth and inflation. The strong July employment data should give the Fed cover to taper the monthly pace of asset purchases sooner and faster than was anticipated.
Recent Economic Data
Nonfarm payroll rose by 943,000 in the initial estimate for July, following +938,000 in June, boosted partly by a seasonal quirk in education (less hiring last fall, fewer seasonal layoffs in June and July). Payrolls fell by 133,000 before seasonal adjustment). Leisure and hospitality (+380,000) continued to strengthen.
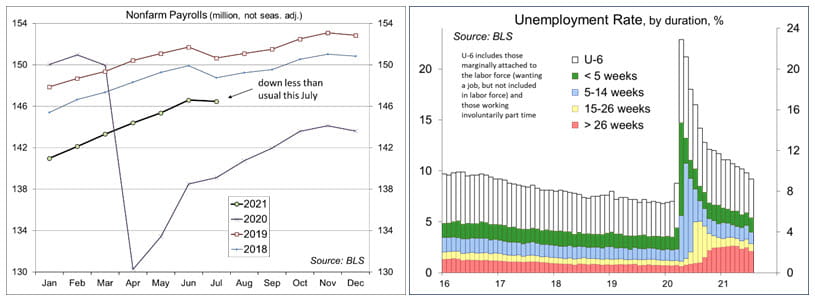
The unemployment fell to 5.4% (from 5.9%), with the rate from prime-age (25-54) workers down to 4.9% (from 5.5%). The employment/population ratio rose to 58.4% (vs. 55.2% a year ago and 61.1% before the pandemic).
The ISM Manufacturing Index edged down to 59.5 in July, vs. 60.6 in June. The ISM Services Index rose to 64.1, vs. 60.1. Both surveys were consistent with strong growth in the near term, with ongoing supply chain issues, input cost pressures, and hiring difficulties.
The trade deficit widened to a record $75.7 billion in June, reflecting further strength in imports. The wider trade deficit subtracted 0.4 percentage point from 2Q21 GDP growth (and -1.6 ppt from 1Q21).
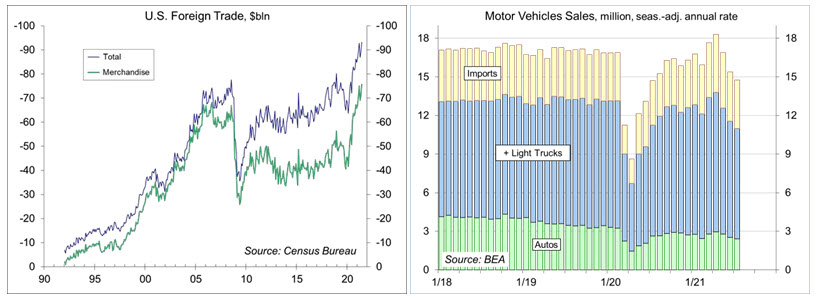
Unit motor vehicle sales fell to a 14.8 million seasonally adjusted annual rate in July (vs. 15.4 million in June), down 19.4% in the last three months. Production constraints related to the semiconductor shortage were likely a factor, but we can expect to see a moderation in consumer goods as service recover.
Gauging the Recovery
The New York Fed’s Weekly Economic Index edged down to +8.29% for the week ending July 31, vs. +8.99% a week earlier (revised from +8.37%), signifying strength relative to the depressed level of a year ago. The WEI is scaled to year-over-year GDP growth (GDP fell 9.1% y/y in 2Q20 and rose 12.2% y/y in 2Q21).
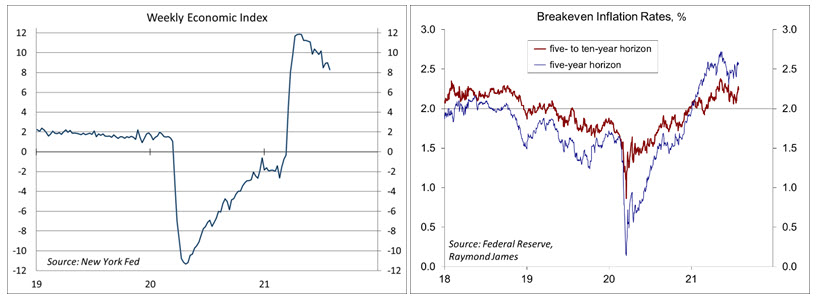
Breakeven inflation rates (the spread between inflation-adjusted and fixed-rate Treasuries, not quite the same as inflation expectations, but close enough) continue to suggest a moderately higher near-term inflation outlook. The 5- to 10-year outlook remains consistent with the Fed’s long-term goal of 2%.
Jobless claims fell by 14,000, to 385,000 in the week ending July 31. Seasonal adjustment can be quirky in July, but the downtrend appears to have flattened in recent weeks.
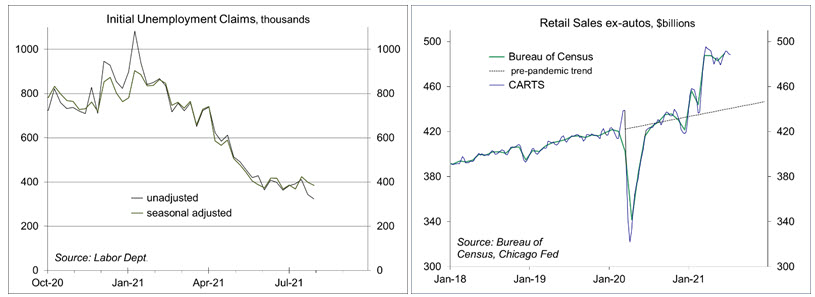
In the second week in July, the Chicago Fed Advance Retail Trade Summary (CARTS) data (based on multiple sources) showed a 0.1% decrease in retail sales (ex-autos), following a 0.4 decline in the previous week. July sales were projected to be unchanged from June.
The University of Michigan’s Consumer Sentiment Index edged up fell to 81.2 in the mid-month assessment for July (the survey covered June 23 to July 26), vs. 80.8 at mid-month, but down from 85.5 in June. Consumers generally expect higher inflation to be transitory, but remained concerned.
The opinions offered by Dr. Brown are provided as of the date above and subject to change. For more information about this report – to discuss how this outlook may affect your personal situation and/or to learn how this insight may be incorporated into your investment strategy – please contact your financial advisor or use the convenient Office Locator to find our office(s) nearest you today.
This material is being provided for informational purposes only. Any information should not be deemed a recommendation to buy, hold or sell any security. Certain information has been obtained from third-party sources we consider reliable, but we do not guarantee that such information is accurate or complete. This report is not a complete description of the securities, markets, or developments referred to in this material and does not include all available data necessary for making an investment decision. Prior to making an investment decision, please consult with your financial advisor about your individual situation. Investing involves risk and you may incur a profit or loss regardless of strategy selected. There is no guarantee that the statements, opinions or forecasts provided herein will prove to be correct.