
The August Employment Report
Chief Economist Scott Brown discusses current economic conditions.
Nonfarm payrolls rose less than expected in the initial estimate for August, likely reflecting an impact from the Delta variant. However, the shortfall (relative to expectations) may have also reflected the usual noise in the data. You should never take a single number at face value. The unemployment rate fell to 5.2%, but details still suggest we still have a long way to go for a full recovery in the labor market.
Some years ago, the Bureau of Labor Statistic began to include the three-month average gain in payrolls in its lead table for the employment report. Why? There’s a lot of noise in the payroll figure, including statistical uncertainty and seasonal adjustment difficulties. The three-month average reduces (but does not eliminate) much of the noise.
Nonfarm payrolls rose by 235,000 in the initial estimate for August, far below the median forecast (don’t call it a “consensus”) of 730,000. The August gain followed more than two million jobs added in the two previous months. Payrolls for June and July were boosted by a seasonal quirk in education. We didn’t hire as many teachers, bus drivers, and lunch ladies (or laddies) as usual at the start of the school year, which means that we didn’t lay off as many at the end of school year. Seasonal adjustment transformed a 1.6 million (unadjusted) May-to-July drop in education payrolls into a 544,000 (adjusted) gain. So let’s throw that out. Ex-education, payrolls averaged a 564,000 gain over the last three months, which is strong.
The establishment survey is for the pay period that includes the 12th of the month – hence, is more reflective of the first half of the month and may have missed much of the economic impact of the Delta variant. Payroll figures for September and October will help to clarify that. In a couple weeks, we’ll get state level data. Early analysis suggests that states that pulled back on federal unemployment assistance did not see appreciable improvement in employment, and in fact, may have experienced somewhat slower consumer spending growth due to the loss of income.
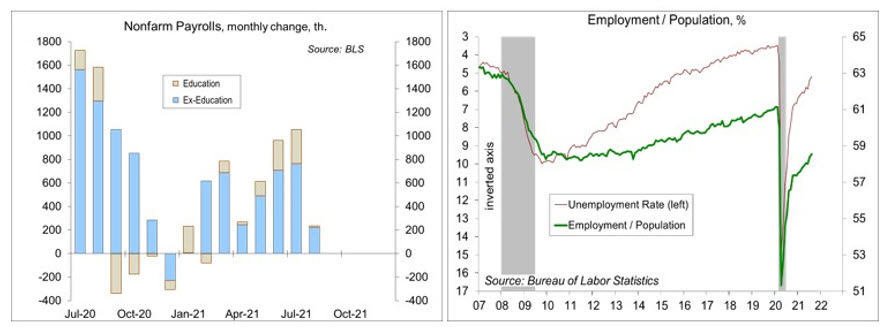
The unemployment rate fell to 5.2% in August. Labor force participation, which ought to improve as the economy recovers, held steady at 61.7%, the same as a year earlier. Unemployment benefits may have been a factor, but ongoing fear of the pandemic and childcare issues have also been cited. Businesses continue to report difficulties in hiring new workers and retaining existing employees (note the firms in manufacturing, construction, and a number of other industries had reported difficulties in finding skilled labor well before the pandemic). It takes time to match unemployed workers with available jobs, and that task is made more difficult by skill and location mismatches. Average hourly earnings rose 0.6% (+4.3% y/y), but that figures is distorted by compositional changes. The recent increase in inflation appears to be due more to supply chain issues, not wage-fueled price increases.
The Fed established “substantial further improvement” toward its employment and inflation goals as a taper trigger. As Chair Powell noted, it’s reached that target on inflation, but this report doesn’t get there on the employment target. The lift-off trigger for short-term interest rates is when the Fed reaches its goals, which is still a long way off.
Recent Economic Data
The ISM Manufacturing Index was little changed at 59.9 in August, vs. 59.5 in July. Purchasing managers noted continued supply constraints, including transportation issues (Asian port disruptions, road and rail domestically), materials shortages (semiconductors), and employment difficulties (hiring new workers and retaining good employees). The ISM Services Index fell to 61.7 in August, following a record 64.1 in July.
The August Employment Report was mixed. Nonfarm payrolls rose by 235,000, following more than two million added in the two previous months.
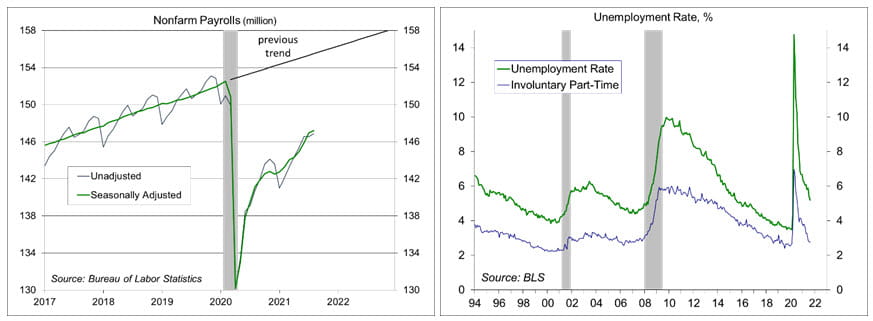
The unemployment rate fell to 5.2% in August. The employment-population ratio edged up to 58.5%, up from 56.5% a year ago, but well below the pre-pandemic level (61.1%).
Unit motor vehicle sales fell 10.7% in August, to a 13.1 million seasonally adjusted annual rate, vs. 14.5 million in July and 15.2 million a year ago. The drop appears to be related to the ongoing semiconductor shortage and will subtract from 3Q21 GDP growth.
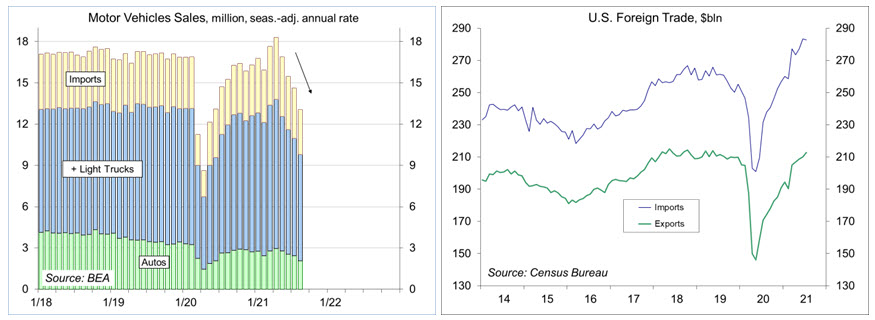
The U.S. trade deficit fell to $70.1 billion in July, following $73.2 billion in June (revised from $75.5 billion, reflecting adjustments to services back to the beginning of the year). Imports edged down 0.2% (+22.1% y/y), possibly reflecting trade difficulties. Exports rose 1.3% (+24.5% y/y).
The Conference Board’s Consumer Confidence Index fell to 113.8 in August, vs. 125.1 in July.
Gauging the Recovery
The New York Fed’s Weekly Economic Index edged up to +7.95% for the week ending August 28, vs. +7.93% a week earlier (revised from +7.32%), as increases in tax withholding, rail traffic, and fuel sales, and a decrease in initial unemployment insurance claims more than offset a decline in electricity output (relative to the same time last year). The WEI is scaled to y/y GDP growth (- 2.9% y/y in 3Q20).
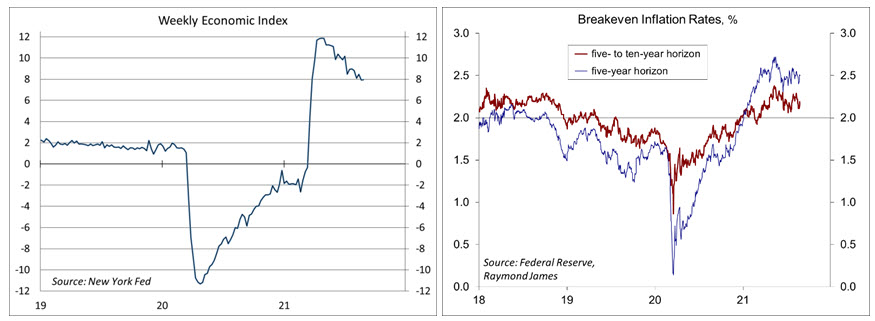
Breakeven inflation rates (the spread between inflation-adjusted and fixed-rate Treasuries, not quite the same as inflation expectations, but close enough) continue to suggest a moderately higher near-term inflation outlook. The 5- to 10-year outlook remains consistent with the Fed’s long-term goal of 2%.
Jobless claims fell by 29,000, to 348,000 (a new pandemic low, but still high by historical standards) in the week ending July 31. Seasonally adjusted figures have been trending about flat in the last several weeks. Unadjusted claims are normally low in August and September.
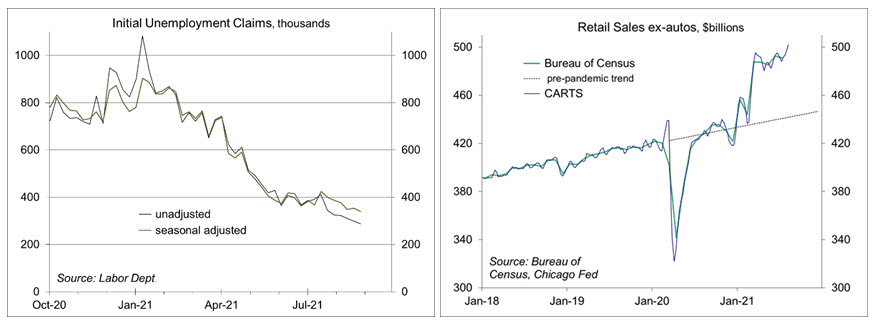
In the second week in August, the Chicago Fed Advance Retail Trade Summary (CARTS) index (a composite of multiple retail gauges) showed a 1.0% increase in retail sales (ex-autos), following a 0.7% rise in the previous week. August retail sales (ex-autos) were projected to be up 2.4% from July.
The University of Michigan’s Consumer Sentiment Index fell to 70.3 in the full-month assessment for August (the survey covered July 28 to August 23), vs. 70.2 at mid-month and 81.2 in July. Expectations sank to 65.1, from 79.0, reflecting concerns about the Delta surge.
The opinions offered by Dr. Brown are provided as of the date above and subject to change. For more information about this report – to discuss how this outlook may affect your personal situation and/or to learn how this insight may be incorporated into your investment strategy – please contact your financial advisor or use the convenient Office Locator to find our office(s) nearest you today.
This material is being provided for informational purposes only. Any information should not be deemed a recommendation to buy, hold or sell any security. Certain information has been obtained from third-party sources we consider reliable, but we do not guarantee that such information is accurate or complete. This report is not a complete description of the securities, markets, or developments referred to in this material and does not include all available data necessary for making an investment decision. Prior to making an investment decision, please consult with your financial advisor about your individual situation. Investing involves risk and you may incur a profit or loss regardless of strategy selected. There is no guarantee that the statements, opinions or forecasts provided herein will prove to be correct.