
Weekly market snapshot
Chief Economist Scott Brown discusses the latest market data.
Fears of tighter Federal Reserve policy continued to weigh on the stock market. The economic calendar was uneventful.
Single-family permits rose 2.0% in December but were still down 8.5% from a year earlier (reflecting supply constraints). Homebuilder sentiment – little changed over the last three months – edged slightly lower in January. Existing home sales fell 6.0% in December (-8.3% y/y), reflecting a record low in the number of homes for sale. Initial claims for unemployment benefits rose by 55,000 in the week ending January 15, to 286,000, likely reflecting the omicron variant (which had a sharp impact on leisure travel and restaurants earlier in the month).
Next week: The Federal Open Market Committee (FOMC) is expected to leave short-term interest rates unchanged but will likely hint at a mid-March hike. (There will be no revised dot plot this time.) Real GDP is likely to have risen at an annual rate of about 6% in the advance estimate for 4Q21, with a large but uncertain contribution from inventories. Quarterly personal income and spending numbers will be included in the GDP report, but December figures should help to gauge the degree of momentum heading into 1Q22.
Indices
| Last | Last Week | YTD return % | |
|---|---|---|---|
| DJIA | 34,715.39 | 35,911.81 | -4.47% |
| NASDAQ | 14,154.02 | 14,893.75 | -9.53% |
| S&P 500 | 4,482.73 | 4,662.85 | -5.95% |
| MSCI EAFE | 2,318.85 | 2,359.59 | -0.74% |
| Russell 2000 | 2,062.78 | 2,162.46 | -9.86% |
Consumer Money Rates
| Last | 1 year ago | |
|---|---|---|
| Prime Rate | 3.25 | 3.25 |
| Fed Funds | 0.07 | 0.08 |
| 30-year mortgage | 3.69 | 2.85 |
Currencies
| Last | 1 year ago | |
|---|---|---|
| Dollars per British Pound | 1.360 | 1.373 |
| Dollars per Euro | 1.131 | 1.216 |
| Japanese Yen per Dollar | 114.110 | 103.500 |
| Canadian Dollars per Dollar | 1.250 | 1.264 |
| Mexican Peso per Dollar | 20.536 | 19.731 |
Commodities
| Last | 1 year ago | |
|---|---|---|
| Crude Oil | 85.55 | 53.13 |
| Gold | 1,844.90 | 1,869.30 |
Bond Rates
| Last | 1 month ago | |
|---|---|---|
| 2-year treasury | 1.03 | 0.62 |
| 10-year treasury | 1.81 | 1.42 |
| 10-year municipal (TEY) | 2.02 | 1.66 |
Treasury Yield Curve – 1/21/2022
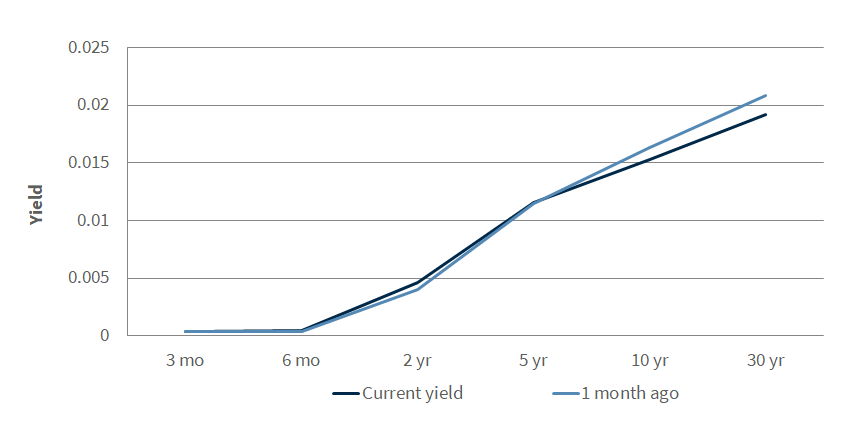
As of close of business 1/20/2022
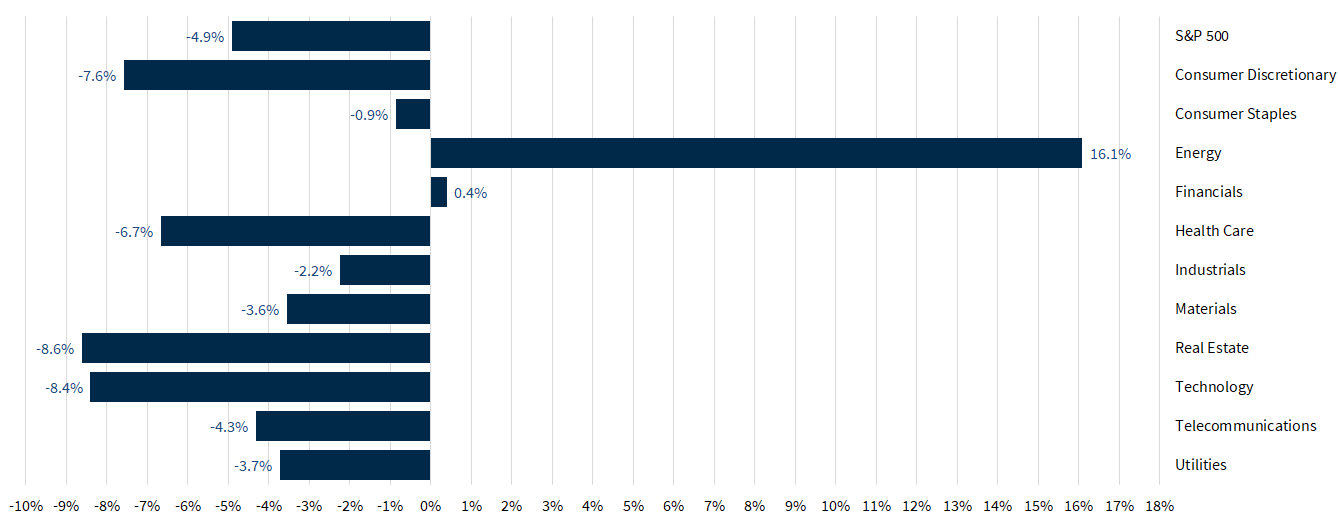
S&P Sector Performance (YTD) – 1/21/2022
Economic Calendar
| January 25 | — | CB Consumer Confidence (January) |
| January 26 | — | New Home Sales (December) |
| — | FOMC policy decision | |
| — | Powell Press Conference | |
| January 27 | — | Jobless Claims (week ending January 22) |
| — | Real GDP (4Q21, advance estimate) | |
| — | Durable Goods Orders (December) | |
| — | Pending Home Sales Index (December) | |
| January 28 | — | Personal Income and Spending (December) |
| — | Employment Cost Index (4Q22) | |
| — | University of Michigan Consumer Sentiment (January) | |
| February 1 | — | ISM Manufacturing Index (January) |
| February 3 | — | ISM Services Index (January) |
| February 4 | — | Employment Report (January) |
| January 10 | — | Consumer Price Index (January) |
| March 16 | — | FOMC policy decision |
All expressions of opinion reflect the judgment of the author and are subject to change. There is no assurance any of the forecasts mentioned will occur or that any trends mentioned will continue in the future. Investing involves risks including the possible loss of capital. Past performance is not a guarantee of future results. International investing is subject to additional risks such as currency fluctuations, different financial accounting standards by country, and possible political and economic risks, which may be greater in emerging markets. While interest on municipal bonds is generally exempt from federal income tax, it may be subject to the federal alternative minimum tax, and state or local taxes. In addition, certain municipal bonds (such as Build America Bonds) are issued without a federal tax exemption, which subjects the related interest income to federal income tax. Municipal bonds may be subject to capital gains taxes if sold or redeemed at a profit. Taxable Equivalent Yield (TEY) assumes a 35% tax rate.
The Dow Jones Industrial Average is an unmanaged index of 30 widely held stocks. The NASDAQ Composite Index is an unmanaged index of all common stocks listed on the NASDAQ National Stock Market. The S&P 500 is an unmanaged index of 500 widely held stocks. The MSCI EAFE (Europe, Australia, Far East) index is an unmanaged index that is generally considered representative of the international stock market. The Russell 2000 index is an unmanaged index of small cap securities which generally involve greater risks. An investment cannot be made directly in these indexes. The performance noted does not include fees or charges, which would reduce an investor’s returns. U.S. government bonds and treasury bills are guaranteed by the US government and, if held to maturity, offer a fixed rate of return and guaranteed principal value. U.S. government bonds are issued and guaranteed as to the timely payment of principal and interest by the federal government. Treasury bills are certificates reflecting short-term (less than one year) obligations of the U.S. government.
Commodities trading is generally considered speculative because of the significant potential for investment loss. Markets for commodities are likely to be volatile and there may be sharp price fluctuations even during periods when prices overall are rising. Specific sector investing can be subject to different and greater risks than more diversified investments. Gross Domestic Product (GDP) is the annual total market value of all final goods and services produced domestically by the U.S. The federal funds rate (“Fed Funds”) is the interest rate at which banks and credit unions lend reserve balances to other depository institutions overnight. The prime rate is the underlying index for most credit cards, home equity loans and lines of credit, auto loans, and personal loans. Material prepared by Raymond James for use by financial advisors. Data source: Bloomberg, as of close of business January 20, 2022.