
The Evolving Inflation Outlook
Chief Economist Scott Brown discusses current economic conditions.
The Consumer Price Index rose 0.6% in January (overall, and ex-food & energy), a bit higher than expected. That brought the year-over-year increase to 7.5%, the largest 12-month gain since February 1982. Digging deeper, there is one inflation story for goods and another for services.
Inflation began to pick up in the spring of 2021. However, much of the initial increase reflected “base effects” (a rebound in prices that had been depressed during the pandemic lockdowns of a year earlier) and restart pressures (supply chain bottlenecks as the economy reopened). Price increases were concentrated in a narrow band of goods and services. By the summer, we were seeing signs that these pressures were abating. However, by autumn, price increases had begun to broaden out across categories, a disturbing sign for Federal Reserve policymakers.
Higher inflation has been pinned largely on supply chain difficulties. Certainly, the pandemic has had an impact on the production and distribution of goods worldwide. Recently, there have been some labor issues related to the January surge in COVID-19 cases, but supply chains have generally improved. Goods are flowing. The number of inbound containers through the ports in Southern California was 13% higher in 4Q21 than it was in 4Q19. However, the bigger issue for inflation has been stronger demand. Part of consumer spending has shifted from services to goods, and this change has been longer-lasting than expected.
The CPI for food rose 0.9% in January (+7.0% y/y), reflecting difficulties in production and distribution. Energy rose 0.9% (+27.0% y/y), with retail gasoline down 0.8% (+40,0% y/y). Higher crude oil prices suggest little relief in the near term.
The shift in spending toward goods is evident in the inflation figures. Ex-food & energy, the CPI for goods rose 1.0% in January, up 11.7% y/y (vs.
+1.5% y/y a year ago). The semiconductor shortage has had a major impact. Prices of new vehicles were flat in January (+12.2% y/y), while the index for used cars and trucks rose 1.5% (+40.5% y/y).
The CPI for non-energy services rose 0.4%, up 4.1% y/y (vs. +1.6% y/y a year ago), largely reflecting a rebound from the low inflation of a year earlier. The price index for transportation services rose 1.0% in January (+5.6% y/y, vs. -3.5% y/y a year ago), while rent of shelter rose 0.4% (+4.4% y/y, vs. +1.9% y/y a year ago).
Tight labor markets have fueled labor cost pressures, threatening to reinforce higher inflation in a wage-price spiral. Labor market conditions are tight. Job vacancies remain sharply elevated, and firms note continued difficulties in hiring new workers and retaining current employees. For some industries, increased labor expenses will be passed along in higher prices, but for the most part, wages are not driving inflation in consumer prices. Yet, faster wage growth can reinforce higher price inflation, as we saw during the Great Inflation of the 1970s and early 1980s.
The Fed has two legislated goals, stable prices and maximum sustainable employment. In past decades, the central bank would raise short-term interest rates to head off inflation before it picked up. Otherwise, it would have to raise rates even more to get inflation back under control. In 2020, the Fed revised its monetary policy framework. It would retain its 2% long-term goal for inflation (as measured by the PCE Price Index), but following a period of inflation below 2%, it would seek to have inflation move moderately above 2% for some time. The Fed also made its employment goal broader and more inclusive. Low-income workers and communities of color typically fare the worst in a recession and recover more slowly in an expansion. However, the belief is that the Fed can best achieve its employment goal over the long run by keeping inflation low.
Following on the heels of the strong January employment report, the CPI data boosted market expectations that the Fed will raise short-term interest rates by 50 basis points at the mid-March policy meeting. However, there are some signs that consumer spending (nearly 70% of Gross Domestic Product) will be slowing. UM Consumer Sentiment fell to 61.7 in the mid-February reading (down from 67.2 in January and 70.6 in December). Wage income growth is supportive, but the extended child tax credit has ended, fiscal stimulus payments are long behind us, and higher inflation erodes purchasing power.
Fed rate hikes won’t do anything to improve supply chains, but should dampen demand and work against an inflationary mindset. The key question is how much spending will slow on its own, without any help from the Fed.
Recent Economic Data
The Consumer Price Index rose 0.6% in January, up 7.5% y/y (vs. +2.0% y/y a year ago) – the highest 12- month increase since February 1982. Food rose 0.9% (+7.0% y/y). Energy rose 0.9% (+27.0% y/y), with gasoline down 0.8% (+40.0% y/y). Ex-food & energy, the CPI rose 0.6%, up 6.0% y/y (vs. +1.8% y/y a year ago).
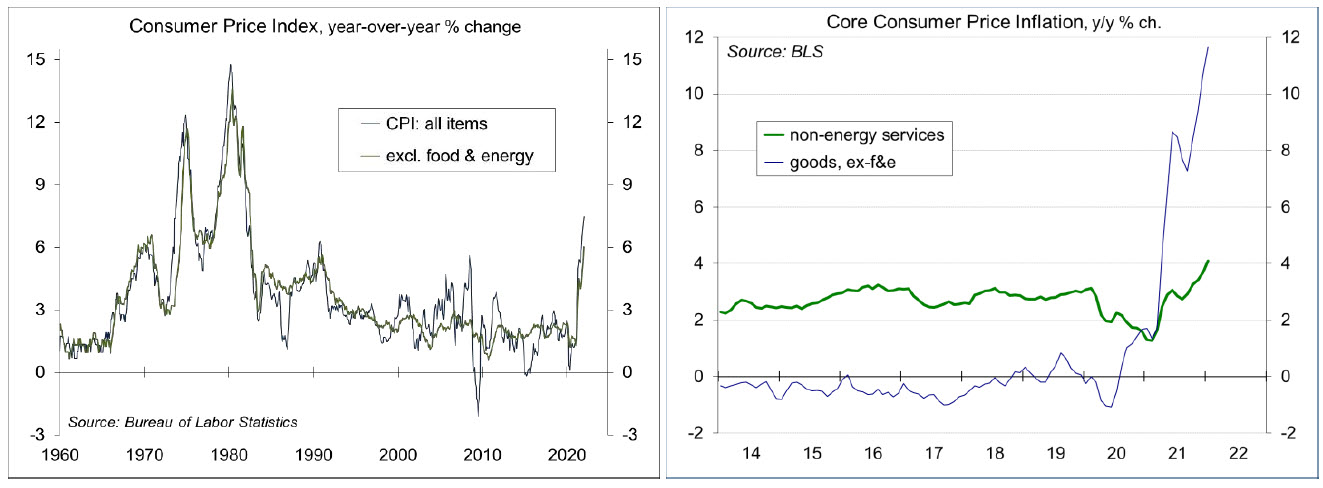
The CPI for goods ex-food & energy rose 1.0% in January, up 11.7% y/y (vs. +1.5% y/y a year ago). Prices of new vehicles were flat (+12.2% y/y), while the index for used cars and trucks rose 1.5% (+40.5% y/y). The CPI for non-energy services rose 0.4%, up 4.1% y/y (vs. +1.6% y/y a year ago), largely reflecting a rebound from the low inflation of a year earlier. The price index for transportation services rose 1.0% (+5.6% y/y, vs. -3.5% y/y a year ago), while rent of shelter rose 0.4% (+4.4% y/y, vs. +1.9% y/y a year ago).
The Cleveland Fed’s Trimmed-Mean CPI (which excludes the categories with the highest 8% and lowest 8% of monthly price changes) rose 0.6% in January, further evidence that price increases have broadened out.
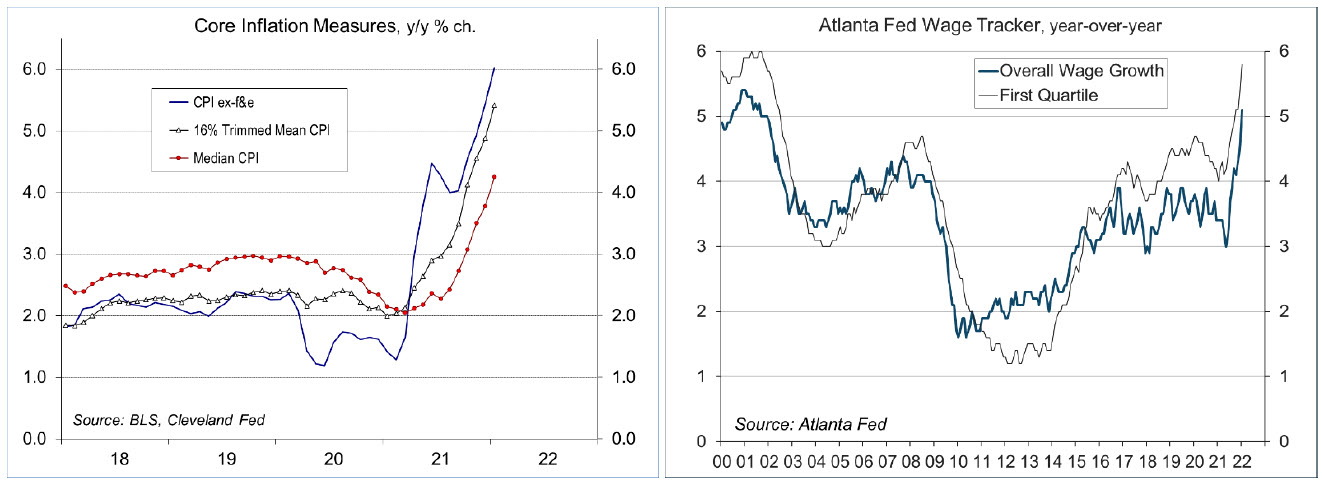
The Atlanta Fed’s Wage Tracker rose 5.1% y/y in January. Gains were more pronounced for those in the lowest quartile of wage earners (the lowest quartile rose 5.8% y/y).
The January CPI Report (following the strong employment report) further raised the odds that the Fed will be more aggressive in raising short-term interest rates.
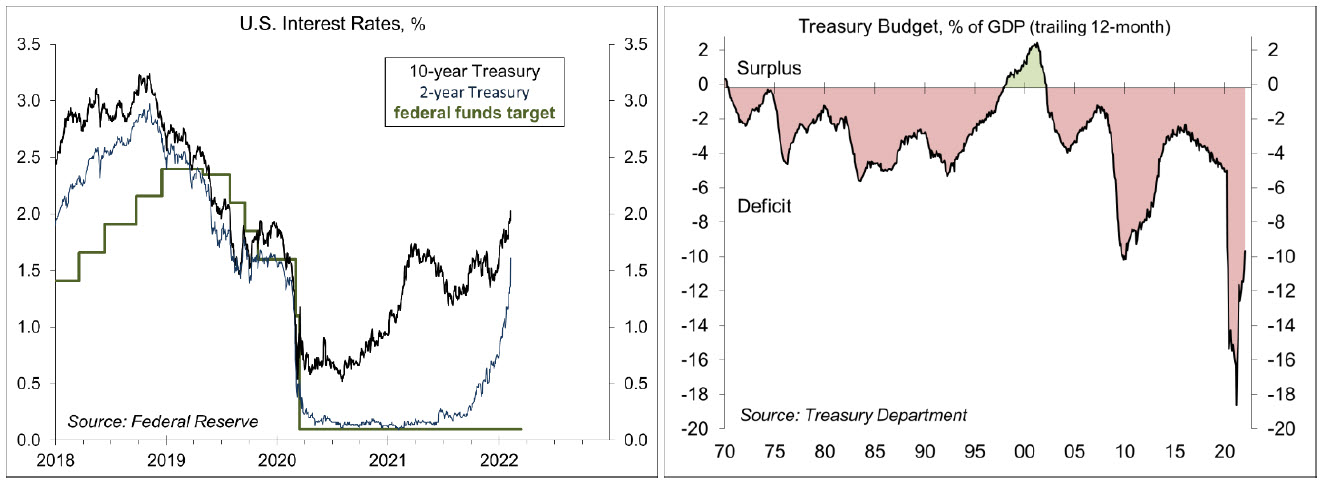
Treasury reported a $118.7 billion surplus in January, vs. a $162.8 billion deficit in January 2021. For the first four months of the fiscal year, receipts are up 27.7% from the same period in FY21, while outlays fell 7.7%.
The U.S. trade deficit widened to $80.7 billion in December. The merchandise trade deficit rose to $101.4 billion (exports up 20.4% y/y, imports up 20.1% y/y). The surplus in services increased to $20.7 billion.
Jobless claims fell by 16,000 in the week ending February 5, to 223,000, reflecting a fading impact from the recent surge in COVID-19 cases.
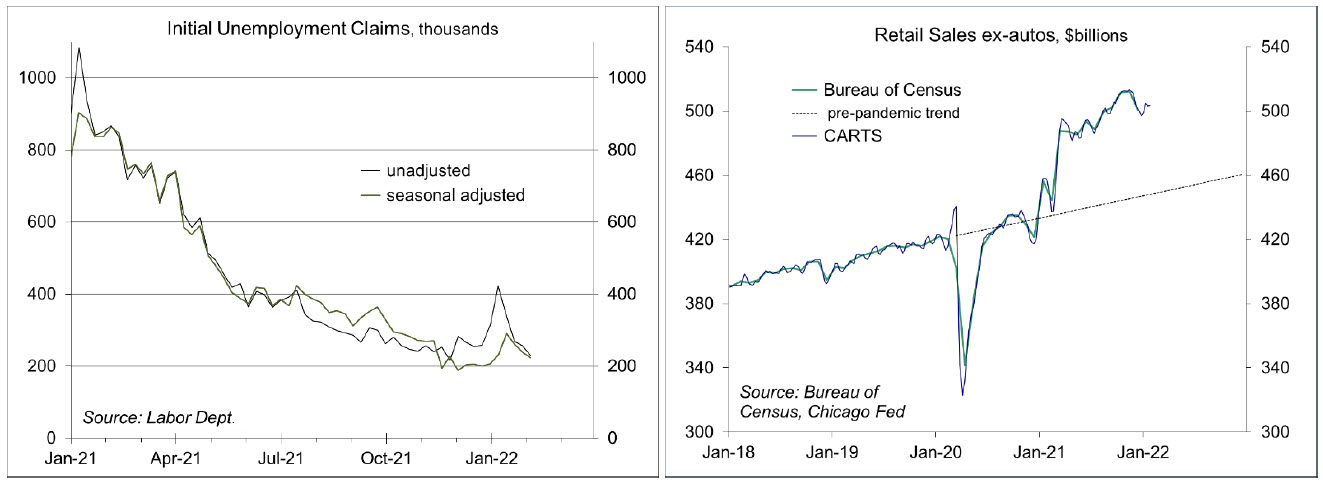
The Chicago Fed Advance Retail Sales Index was unchanged in the fourth week of January, following a 0.4% decline in the previous week. The data suggest that January retail sales ex-autos rose 0.4% from December (unchanged adjusting for inflation).
The UM Consumer Sentiment Index fell to 61.7 in the mid-February estimate (the survey ran from January 26 to February 9) – it’s worst level in a decade. Inflation has a larger impact on lower-income households, but “the entire February decline was among households with incomes of $100,000 or more,” according to the report (reflecting the drop in the stock market). The report points to a slowing in consumer spending.
The opinions offered by Dr. Brown are provided as of the date above and subject to change. For more information about this report – to discuss how this outlook may affect your personal situation and/or to learn how this insight may be incorporated into your investment strategy – please contact your financial advisor or use the convenient Office Locator to find our office(s) nearest you today.
This material is being provided for informational purposes only. Any information should not be deemed a recommendation to buy, hold or sell any security. Certain information has been obtained from third-party sources we consider reliable, but we do not guarantee that such information is accurate or complete. This report is not a complete description of the securities, markets, or developments referred to in this material and does not include all available data necessary for making an investment decision. Prior to making an investment decision, please consult with your financial advisor about your individual situation. Investing involves risk and you may incur a profit or loss regardless of strategy selected. There is no guarantee that the statements, opinions or forecasts provided herein will prove to be correct.