
A preview of Powell’s monetary policy testimony
Chief Economist Scott Brown discusses current economic conditions.
The Fed Chair will present the central bank’s semiannual report on the economy and Fed policy to Congress. The report, released on Friday, is a good summary of current conditions, with in-depth discussions of key topics (including low labor supply, the distribution of wage and employment growth, the broadening of inflation, supply bottlenecks, and the Fed’s balance sheet).
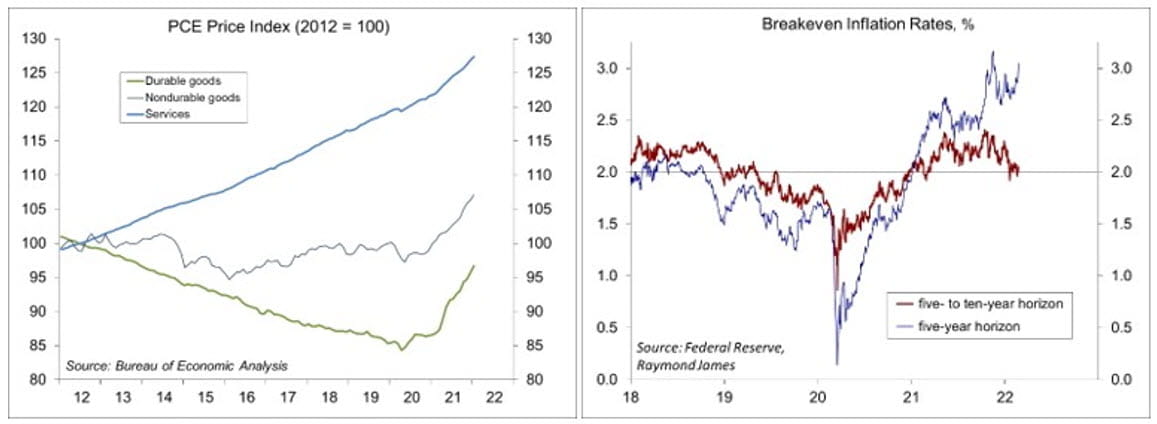
The personal consumption expenditures (PCE) price index rose 6.1% over the 12 months ending in January and the index that excludes food and energy was up 5.2% — the highest readings in roughly 40 years. The Fed’s Monetary Policy Report to Congress notes that “upward pressure on inflation from prices of goods experiencing both supply chain bottlenecks and strong demand, such as motor vehicles and furniture, has persisted, and elevated inflation has broadened out to a wider range of items.” In addition, “services inflation has also stepped up further, reflecting strong wage growth in some service sectors and a significant increase in housing rents.” Importantly, “while measures of near-term inflation expectations moved substantially higher over the course of last year, measures of longer-term inflation expectations have moved up only modestly; they remain in the range observed over the decade before the pandemic and thus appear broadly consistent with the FOMC’s longer-run inflation objective of 2%.”
The report noted that “with inflation well above the [Federal Open Market] Committee’s 2% longer-run goal and a strong labor market, the Committee expects it will soon be appropriate to raise the target range for the federal funds rate.” This was the same phrase in the January 26 policy statement and a clear indication that short-term rates will be raised at the next policy meeting (March 15-16). The phrase does not say how much the Fed will hike in March. Inflation figures have not been favorable and there’s are some good arguments for a large increase (50 basis points or more). However, most Fed officials appear to be more comfortable with a smaller move (25 bps).
Investors had keyed in on the 25/50 debate, and took some comfort as expectations for a smaller move solidified. However, most missed a key point of the January 25-26 FOMC minutes – that the Fed would raise rates more rapidly than in the previous tightening cycle (when the Fed raised rates mostly at every other FOMC meeting). We can expect a quarter-point hike at each FOMC meeting, with a likely pause when the Fed begins balance sheet reduction later this year.
How does the situation in Ukraine affect the Fed policy outlook? Higher oil prices are seen in the short-term and that’s not helpful in the current inflation environment. However, longer-term oil futures contracts suggest an expectation that the situation will stabilize and (spot) oil prices will retreat. There is hope that Russia may come to the bargaining table. Assuming that we don’t get involved militarily, the impact on the U.S. economy is likely to be minor.
Recent Economic Data
Personal income was unchanged in January (-2.1% y/y), as the end of the extended child tax credit was partly offset by the 5.9% cost-of-living adjustment in Social Security. Private-sector wage and salary income rose 0.5% (+11.2% y/y). Real (inflation-adjusted) disposable income fell 0.5% (-9.9% y/y).
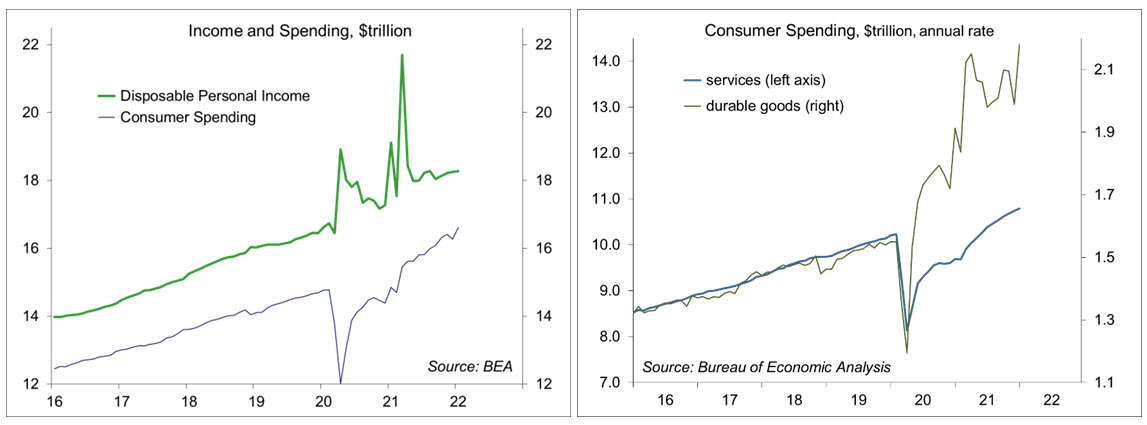
Personal spending rose 2.1% (+11.8% y/y), reflecting what appears to be a seasonal quirk (shifting spending from December into January). Spending on durables rose 9.7% (following -5.1% in December) – still well above the pre-pandemic trend. Spending on nondurables rose 2.6% (vs. -2.2% in December).
The PCE Price Index rose 0.6% in January (+6.1% y/y), up 0.5% (+5.2% y/y) excluding food and energy. The index for durables rose 1.0% (+11.6% y/y), the index for nondurables rose 0.7% (+7.2% y/y), and the index for services rose 0.4% (+4.6% y/y). The Dallas Fed’s Trimmed-Mean PCE Price Index rose 3.1% y/y.
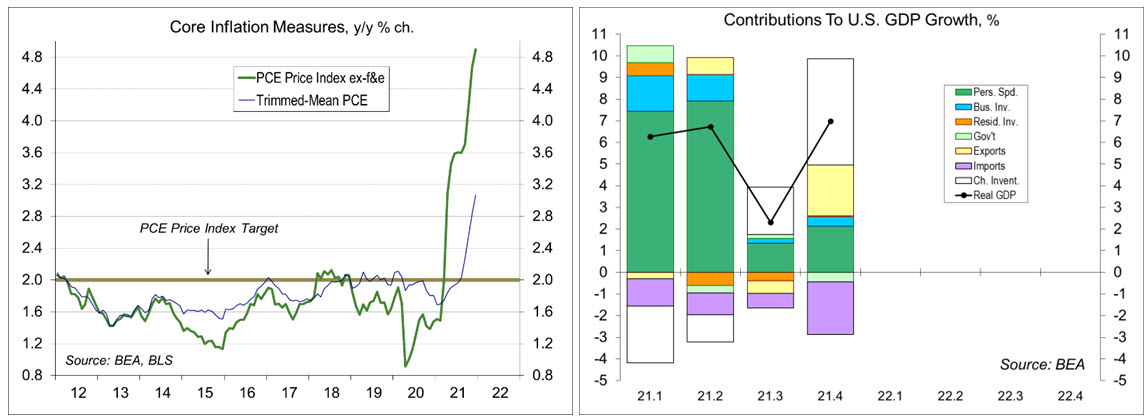
Real GDP rose at a 7.0% annual rate in the 2nd estimate (vs. +6.9% in the advance estimate). The shift in inventories from a decline to a large increase added 4.9 percentage points to headline growth.
New home sales fell 4.8% to an 801,000 seasonally adjusted annual rate in January (-19.3% y/y).
The Pending Home Sales Index fell 5.7% in January (-9.5% y/y), reflecting a low number of homes for sale.
Durable goods orders rose 1.6% in the initial estimate for January, with a large upward revision to December (+1.2%, vs. -0.7% in the previous estimate). Civilian aircraft orders jumped 15.6%). Ex- transportation, orders rose 0.7% (also with an upward revision to December).
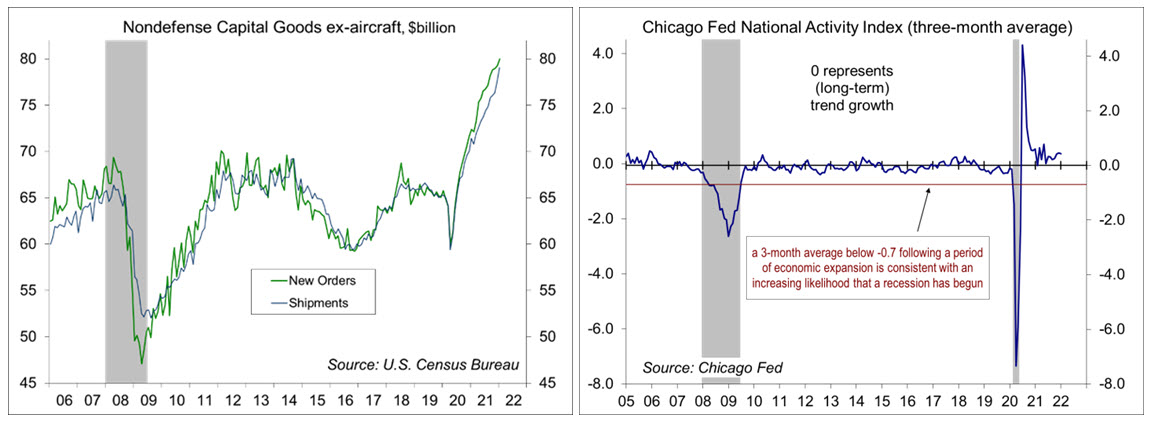
The Chicago Fed National Activity Index, a composite of 85 economic indicators rose to 0.69 in January (the index is designed so that 0 represents trend growth). The three-month average was 0.42, consistent with above-trend growth in the near term (the Fed would like to get that down to trend).
The Chicago Fed Advance Retail Sales (CARTS) data showed a 0.2% increase in the second week of February, following 0.2% gain in the first week. The report noted that February retail sales ex-autos are projected to increase 1.8% from January on a seasonally adjusted basis (in other words, still strong).
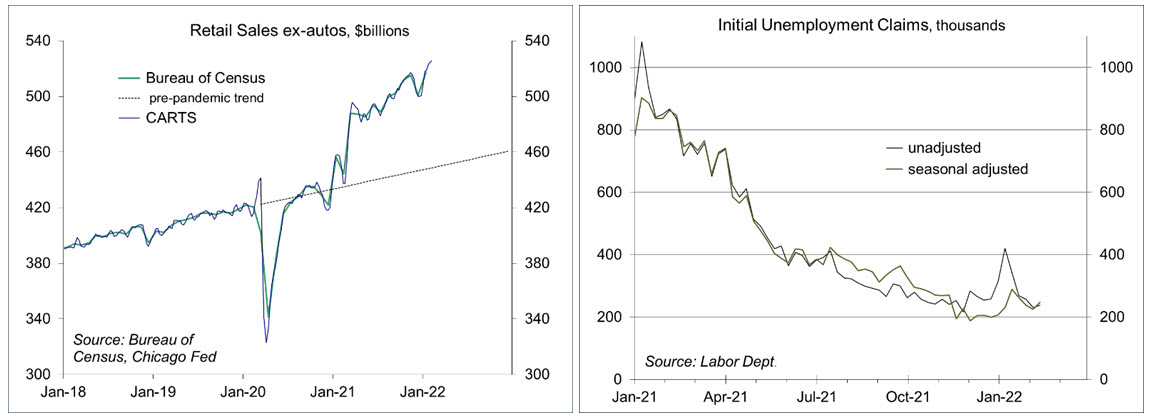
Jobless claims fell by 17,000 in the week ending February 19, to 232,000.
The UM Consumer Sentiment Index fell to 62.8 in February, from 67.2 in January, the lowest level in a decade. The drop was due entirely to declines among households with incomes over $100,000 (reflecting concerns about inflation and interest rates). The survey was taken before the Russian invasion of Ukraine.
The Conference Board’s Consumer Confidence Index fell to 110.5 in the initial estimate for February (the cutoff date was February 16). Respondents remained generally optimistic about the economy in the near term, but were relatively neutral about the long-term prospects.
The opinions offered by Dr. Brown are provided as of the date above and subject to change. For more information about this report – to discuss how this outlook may affect your personal situation and/or to learn how this insight may be incorporated into your investment strategy – please contact your financial advisor or use the convenient Office Locator to find our office(s) nearest you today.
This material is being provided for informational purposes only. Any information should not be deemed a recommendation to buy, hold or sell any security. Certain information has been obtained from third-party sources we consider reliable, but we do not guarantee that such information is accurate or complete. This report is not a complete description of the securities, markets, or developments referred to in this material and does not include all available data necessary for making an investment decision. Prior to making an investment decision, please consult with your financial advisor about your individual situation. Investing involves risk and you may incur a profit or loss regardless of strategy selected. There is no guarantee that the statements, opinions or forecasts provided herein will prove to be correct.