The GDP Arithmetic
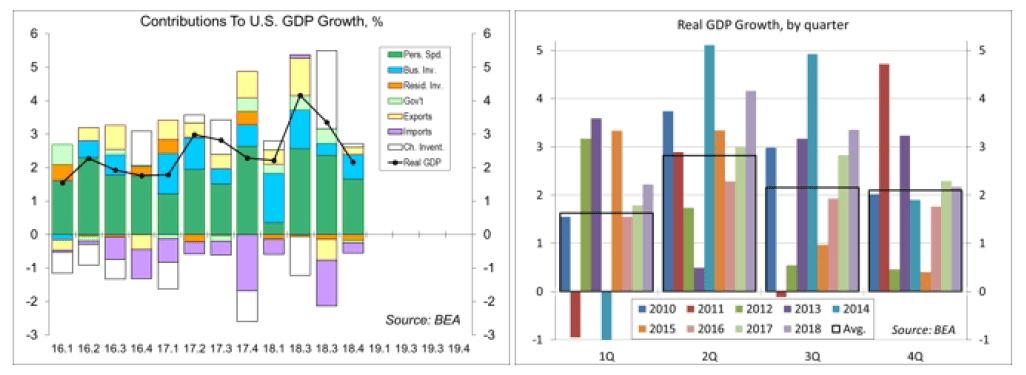
The GDP Arithmetic – As anticipated, the estimate of fourth quarter GDP growth was revised lower (to 2.2%, vs. +2.6% in the “initial” estimate). All major components grew a bit less than in the previous estimate. Recent figures have generally been consistent with a lackluster pace of growth in 1Q19. However, while we are poised to see a pickup in general economic activity in the second quarter, the pace for the year as a whole is likely to be slower than was expected a few months ago – and the risks to the growth outlook are tilted to the downside. Is that enough for the Fed to lower short-term interest rates? Not yet, but it will depend on the incoming data.
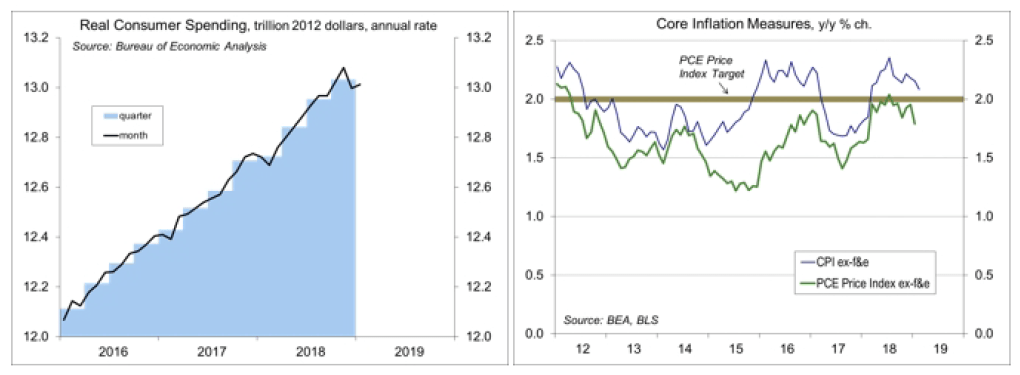
GDP growth naturally varies from quarter to quarter. So one or two soft quarters is nothing to worry about. Similarly, one or two strong quarters is nothing to crow about. However, in hindsight, last year’s fiscal stimulus (tax cuts and increased government spending) appears to have been more front-loaded than expected. We only have consumer spending numbers for January, which are subject to revision, but the improvement following an unusually weak December was disappointing. That may reflect an impact from the partial government shutdown, which would be consistent with a rebound in growth in the second quarter. Despite the BEA’s efforts to eliminate residual seasonality, the first quarter GDP figures in recent years have tended to be below average, while the second quarter figures have tended to be above average. This pattern may be repeating in 2019.
The inflation figures for January surprised to the downside. The PCE Price Index excluding food and energy rose just 0.1% in January (+0.065 before rounding), vs. +0.2% for the core Consumer Price Index (which rose just 0.1% in February). The year-over-year increase in the core PCE Price Index was 1.8% and may edge lower. The inflation figures suggest that the Fed should be in no hurry to raise short-term interest rates. The federal funds futures market has been pricing in about a 65% chance of one or more Fed rate cuts by the end of the year. These probabilities can move quickly. We saw a similar development at the start of the year, but market expectations shifted to a more neutral policy outlook following Fed Chairman Powell’s indication that the Fed will be patient and flexible.
At this point, we’re likely to see a pickup in growth in 2Q19, but that’s not much of a stretch following a weak 1Q19. Note also that parts of the economy typically grow at different rates. As the underlying trend in overall economic growth slows, some sectors of the economy may contract – but a recession in one part of the economy doesn’t mean a recession for the whole economy.
Data Recap – The estimate of 4Q18 GDP growth was revised lower, while the broad range of other economic figures pointed to a sub-par rate of growth in 1Q19. Yet, investors continued to downplay the data. Nor were they perturbed by the prospects for a messy Brexit. However, hope for a U.S./China trade deal remained an important driver of market sentiment.
Special Prosecutor Robert Mueller submitted a 300-page report following his 22-month investigation on the Trump campaign’s ties to Russia, which U.S. Attorney General summarized in a four-page memo.
Real GDP rose at a 2.2% annual rate in the 3rd estimate for 4Q18 (vs. +2.6% in the “initial” estimate). Real consumer spending rose at a 2.5% pace (vs. +2.8%), while business fixed investment rose 5.4% (vs. +6.2%). Residential fixed investment fell at a 4.7% annual rate (vs. -3.5%). Government consumption and investment fell 0.4% (vs. +0.4%). Inventories rose at a faster pace, but not as fast as in the initial estimate, adding 0.1 percentage point to GDP growth. The trade deficit was not as wide as initially reported, subtracting 0.1 percentage point from growth. Corporate profits fell by $9.7 billion in 4Q18 (vs. +$78.2 billion in 3Q18), with domestic nonfinancial profits up $13.6 billion (vs. +$83.0 billion).
Personal Income rose 0.2% in January, following a 0.1% decline in January and a 1.0% gain in December (most of that volatility is reflected in farm subsidies and dividends). Aggregate private-sector wages and salaries rose 0.3%, following +0.6% in December and +0.4% in January (weather may have been a factor in February). Personal Spending edged up 0.1% in the initial estimate for January, following a 0.6% decline in December (+3.7% y/y), reflecting a drop in autos and lower gasoline prices (ex-autos and gasoline, spending would have risen 0.4%). The PCE Price Index fell 0.1% (-0.060% before rounding, +2.3% y/y), up 0.1% ex-food & energy (+0.065% before rounding, +1.8% y/y).
The University of Michigan Consumer Sentiment Index rose to 98.4 in March, vs. 93.8 in February and 91.2 in January. Gains were concentrated in households in the lower two-thirds of income. The index for the upper third fell, but remained high by historical standards. The report noted that “overall, the data do not indicate an emerging recession but point toward slightly lower unit sales of vehicles and homes during the year ahead.”
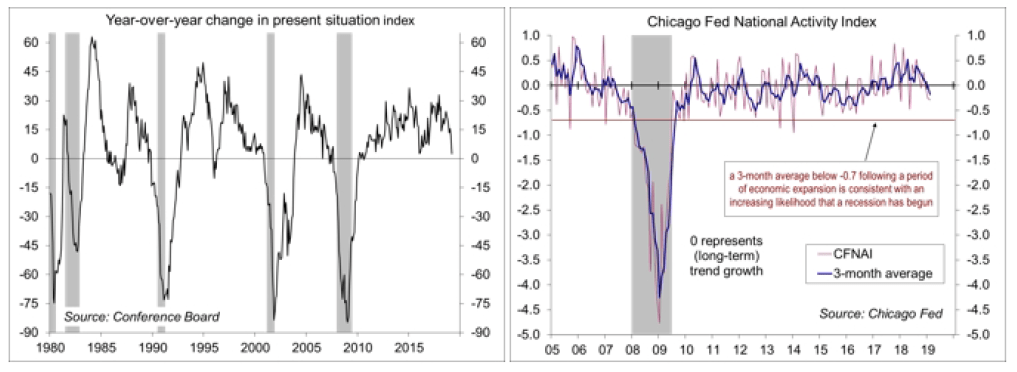
The Conference Board’s Consumer Confidence Index fell to 124.1 in the advance estimate for March, vs. 131.4 in February and 121.7 in January. Most of the decline was in evaluations of current conditions (160.0, vs. 172.8 in February). The year-over-year increase in the present situation index is a recession gauge, although it sometimes gives false signals.
The Chicago Fed National Activity Index, a composite of 85 economic indicators, fell to -0.29 in the initial estimate for February. At -0.18, the three-month average was consistent with near-term growth below the longer-term trend.
The U.S. Trade Deficit narrowed to $51.1 billion in the initial estimate for January, vs. $59.9 billion in December and $50.5 billion in November, partly reflecting lower oil prices.
The Current Account Deficit, the widest measure of trade activity, rose to $134.4 billion in 4Q18 (2.6% of GDP), vs. $126.6 billion in 3Q18 (2.5% of GDP).
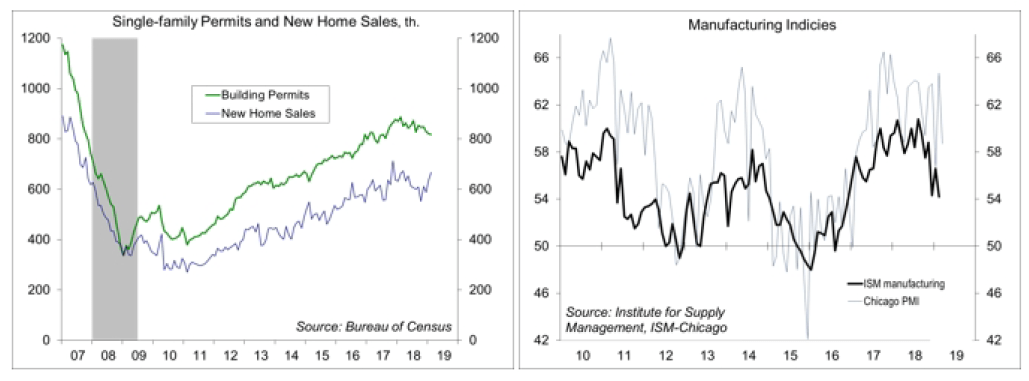
New Home Sales rose 4.9% (±14.4%) in the initial estimate for February, to a 667,000 seasonally adjusted annual rate (+0.6% y/y). These figures are erratic (choppy and subject to large revisions), but the February gain is consistent with the drop in home mortgage rates.
The Pending Home Sales Index fell 1.0% in the initial estimate for February, following a 4.3% rise in January (-4.9% y/y).
Building Permits slipped 2.0% in the revised estimate for February, to a 1.291 million seasonally adjusted annual rate (-2.4% y/y). Single-family permits, the key figure in the report, fell 0.5% (-7.8% y/y). Housing Starts fell 8.9%, to a 1.162 million pace (-9.9%, with single family permits down 17.0% (-10.6% y/y). Note that housing starts are reported with a huge degree of uncertainty and weather may have been a factor in February.
The Chicago Business Barometer fell to 58.7 in March (still strong), vs. 64.7 in February. Order backlogs fell into contraction for the first time since January 2017 (it’s only one month, but the decline is a red flag).
The opinions offered by Dr. Brown should be considered a part of your overall decision-making process. For more information about this report – to discuss how this outlook may affect your personal situation and/or to learn how this insight may be incorporated into your investment strategy – please contact your financial advisor or use the convenient Office Locator to find our office(s) nearest you today.
All expressions of opinion reflect the judgment of the Research Department of Raymond James & Associates (RJA) at this date and are subject to change. Information has been obtained from sources considered reliable, but we do not guarantee that the foregoing report is accurate or complete. Other departments of RJA may have information which is not available to the Research Department about companies mentioned in this report. RJA or its affiliates may execute transactions in the securities mentioned in this report which may not be consistent with the report’s conclusions. RJA may perform investment banking or other services for, or solicit investment banking business from, any company mentioned in this report. For institutional clients of the European Economic Area (EEA): This document (and any attachments or exhibits hereto) is intended only for EEA Institutional Clients or others to whom it may lawfully be submitted. There is no assurance that any of the trends mentioned will continue in the future. Past performance is not indicative of future results.


