
High quality
Drew O’Neil discusses fixed income market conditions and offers insight for bond investors.
For many investors, fixed income investments have a primary objective of preserving wealth. The known characteristics of owning individual bonds are a major reason for this: known income, known cash flow, known redemption date, known redemption value. From day one when you purchase a bond, all of this is locked in and does not change. This is because when you purchase a bond, you are essentially lending money to the issuer, who is legally bound by a set of fixed terms that were laid out when they issued the bond. There are primarily two ways that these known outcomes won’t come to fruition. One is if you choose to sell the bond prior to it being redeemed, which is something that is controlled by you, the investor. The other is if the issuer defaults. While the risk of a default can never be completely eliminated, choosing high credit quality issuers can help to minimize the chances of a default as using investment-grade credits makes a default event highly unlikely.
While the past is not a guarantee of what future results will be, analyzing historical data can provide valuable insights and help to ensure that investment choice aligns with personal risk considerations. The chart below shows the average default rate over a rolling 5-year period for corporate bonds from 1983 to 2022. The ratings listed above the red line are investment-grade. The ratings listed below the red line are speculative-grade, also known as high-yield or junk bonds. The Default Rate column are the Moody’s reported statistics. In my opinion, looking at things from the opposite point of view helps to put things in perspective, so the “Non-Default Rate” column was added. This shows the percentage of time that a bond in each category did not default over a 5-year period. For example, if you owned an A-rated corporate bond, there is a 99.3% chance that the bond didn’t default over a given 5-year period.
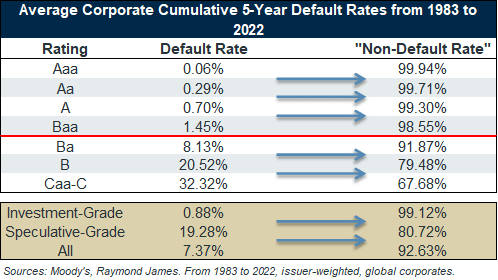
These numbers help to explain why many investors choose to allocate the fixed income portion of their portfolio into investment-grade corporate bonds. For an investment intended to preserve wealth, a ~99% “success rate” of an investment doing exactly what it said it was going to do is an attractive opportunity. Even at the low end of the investment-grade spectrum (Baa rated bonds), a 98.55% non-default rate combined with the yields available represents an attractive risk/reward dynamic for investors. Another thing to keep in mind when looking at these numbers is that, although anything is possible, the move towards a default generally takes places over a period of time and can be witnessed as a string of downgrades as the credit quality of the company gradually deteriorates. Oftentimes, this gives investors the opportunity to sell the bond well before a company defaults if the credit quality of the issuer no longer aligns with an investor’s risk tolerance.
On the other side of the coin, looking at the speculative-grade statistics, the increased risk in buying junk bonds is clear. Just crossing over the threshold by one rating category, from Baa to Ba, sees a fivefold increase in the average default rate. Jump down one more category and the numbers increase to 1 in 5. That is not to say that these bonds do not have a place in some portfolios, but for the capital preservation portion of a portfolio, investment-grade bonds are much better suited to the task.
Source: Moody’s Investor Service Annual default study, April 14, 2023.
The author of this material is a Trader in the Fixed Income Department of Raymond James & Associates (RJA), and is not an Analyst. Any opinions expressed may differ from opinions expressed by other departments of RJA, including our Equity Research Department, and are subject to change without notice. The data and information contained herein was obtained from sources considered to be reliable, but RJA does not guarantee its accuracy and/or completeness. Neither the information nor any opinions expressed constitute a solicitation for the purchase or sale of any security referred to herein. This material may include analysis of sectors, securities and/or derivatives that RJA may have positions, long or short, held proprietarily. RJA or its affiliates may execute transactions which may not be consistent with the report’s conclusions. RJA may also have performed investment banking services for the issuers of such securities. Investors should discuss the risks inherent in bonds with their Raymond James Financial Advisor. Risks include, but are not limited to, changes in interest rates, liquidity, credit quality, volatility, and duration. Past performance is no assurance of future results.
Investment products are: not deposits, not FDIC/NCUA insured, not insured by any government agency, not bank guaranteed, subject to risk and may lose value.
To learn more about the risks and rewards of investing in fixed income, access the Financial Industry Regulatory Authority’s website at finra.org/investors/learn-to-invest/types-investments/bonds and the Municipal Securities Rulemaking Board’s (MSRB) Electronic Municipal Market Access System (EMMA) at emma.msrb.org.