
A Downshift in Expectations for 4Q19
Chief Economist Scott Brown discusses current economic conditions.
Focusing more on a possible mini trade deal with China, financial market participants have largely ignored the recent economic data reports. The figures suggest a softer growth trend in early 4Q19 and many economists have been lowering their GDP forecasts. Growth is often lumpy from quarter to quarter and the fundamentals imply a moderate economic expansion in 2020. However, as widely noted, recessions are often psychological in nature.
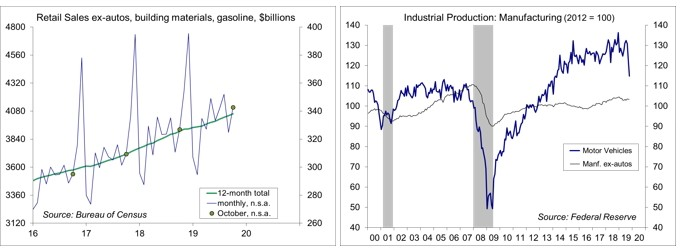
Core retail sales (which excluding motor vehicles, building materials, and gasoline) were reported to have risen by 0.2% in October, following no gain in September and a 0.2% rise in August. This softer trend (+0.4% over the last three months) follows strength in the spring and early summer. It’s not unusual to see a few soft months following a few strong months. Although slower than in 2018, growth in nonfarm payroll has been moderately strong and wage growth has picked up. However, there is a wide range across the income scale. Those at the top are doing well and those at the bottom have seen the largest wage growth (granted, from a low base). However, there is anecdotal evidence of strain across the broad middle. More individuals are opting for longer loans when buying a new vehicle, while more are under water on their trade-in vehicle (that is, owing more than the car is worth)
Retail sales data are seasonally adjusted, but there is also likely some change underway in the seasonal pattern. Last year, holiday shopping had a lower peak in December, but a broader base for the fourth quarter (some sales apparently shifted into October). That could reflect the continued rise in online shopping and a softening in sales at brick and motor stores. Figures for the next few months could be distorted, but the trend retail sales is softer than expected into 4Q19.
Industrial production was weaker than expected in October, reflecting a drop in the output of utilities. As expected, the GM strike (now settled) had a further impact on manufacturing output. In addition, the Fed’s gauge of oil and gas well drilling fell 5.1% (-15.4% in the last four months). Energy exploration is capital intensive and we should see a further negative contribution to business fixed investment in 4Q19.
Most economists forecast GDP growth by forecasting the components and adding them up. The Atlanta Fed’s GDP Now model has lowered its estimate for 4Q19 to a 0.3% annual rate, mostly reflecting slower inventory growth and a wider trade deficit, but with a further decline in business structures (which includes energy exploration) and slower consumer spending growth. The New York Fed’s Nowcast model is projecting a 0.4% annual rate. These models are more science than art. There is no room for subjectivity. The late Nobel Laureate Lawrence Klein applied what he called “TLC” (tender loving care) to his forecasts. Adding more variable gives you a better fit to the past, but may not help in forecasting.
At this point, we have a limited picture of the 4Q19 economy, but (at face value) the underlying trends in the GDP component data appear to be softer. A 4Q19 slowdown should be transitory, but there is a danger that negative expectations could build and become self-reinforcing. The Federal Reserve is poised to react if necessary. (M19-2827783)
Data Recap – Fed Chair Powell repeated that the stance of monetary policy appears to be appropriate for now, while cautioning lawmakers about the federal budget deficit. As expected, seasonal adjustment amplified an increase in gasoline prices in both the CPI and PPI, but core inflation was moderate and pipeline inflation pressures continued to recede. Retail sales results for October were largely in line with expectations, but core sales for August and September were revised lower (implying a slower near-term trend in consumer spending growth). Industrial production fell further in October, reflecting the GM strike and a drop in the output of utilities (otherwise, the manufacturing output weakened modestly).
In his congressional testimony, Fed Chair Powell repeated that “we see the current stance of monetary policy as likely to remain appropriate as long as incoming information about the economy remains broadly consistent with our outlook of moderate economic growth, a strong labor market, and inflation near our symmetric 2% objective.” Powell noted that “in a downturn, it would also be important for fiscal policy to support the economy” and “the federal budget is on an unsustainable path.” This outlook “could restrain fiscal policymakers’ willingness or ability to support economic activity during a downturn” and “restrain private investment, reducing productivity and overall economic growth.”
The Fed’s Financial Stability Report noted some vulnerabilities. Asset prices “remain high in several markets relative to income streams.” However, “risk appetite measures that account for the low level of long-term yields on U.S. Treasury securities are more aligned with historical norms for most markets.” Borrowing by businesses is “historically high relative to GDP, with the most rapid increases in debt concentrated among the riskiest firms amid weak credit standards.” By contrast, “household borrowing remains at a modest level relative to income, and the amount of debt owed by borrowers with credit scores below prime has remained flat.” The largest U.S. banks remain strongly capitalized, and the leverage of broker-dealers is at historically low levels. Estimates of the total amount of financial system liabilities that are most vulnerable to runs, including those issued by nonbanks, remain “modest.” The report noted that “stresses in Europe, such as those related to Brexit; stresses in emerging markets; and an unexpected and marked slowdown in U.S. economic growth are among the near-term risks that have the potential to interact with these vulnerabilities and pose risks to the financial system.”
Retail Sales rose 0.3% in the advance estimate for October, following a 0.3% decline in September (+3.1% y/y). Ex-autos, sales rose 0.2% (+2.8% y/y). Auto dealership sales rose 0.5% (+4.5% y/y), while unit motor vehicle sales were reported lower by the various automakers. Sales of building materials and garden supplies fell 0.5% (-2.0% y/y). Gasoline sales rose 1.1% (-5.0% y/y). Core sales, which exclude motor vehicles, building materials, and gasoline, rose 0.2%, with downward revisions to August and September – implying, all else equal, a slight downward revision to 3Q19 GDP growth and lower consumer spending growth expectations for 4Q19. Department store sales edged up 0.1% (-6.9% y/y), while non-store retail sales (including internet shopping) rose 0.9% (+14.3% y/y). Sales at restaurants and bars fell 0.3% (September revised higher, +4.7% y/y).
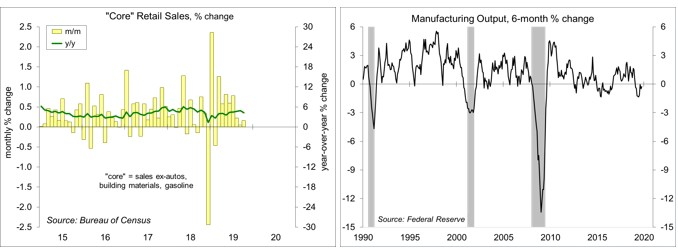
Industrial Production fell 0.8% in the initial estimate for October (-1.1% y/y), reflecting a 2.6% decline in the output of utilities (-4.1% y/y) and a further impact of the GM strike (motor vehicle production fell 7.1% following a 5.5% decline in September, -11.8% y/y). Ex-motor vehicles, manufacturing output edged down 0.1% (-0.6% y/y) – consistent with a moderate slowdown, rather than a recession. Mining output fell 0.7% (+2.7% y/y). Oil and gas well drilling fell 5.1% (-15.4% in the last four months, down 19.0% y/y), implying a further negative contribution to business fixed investment in 4Q19. Energy extraction rose 0.7% (+8.0% y/y).
The Consumer Price Index rose 0.4% in October (+1.8% y/y). Food rose 0.2% (+2.1% y/y), mixed over the last year (food at home up 1.0% y/y, food away from home up 3.3% y/y). Gasoline (3.9% of the overall CPI) rose 3.7% (+1.6% before seasonal adjustment, and -7.3% y/y). Ex-food & energy, the CPI rose 0.2% (+0.157% before rounding, +2.3% y/y). Bear in mind that the year-over-year change in the core PCE Price Index has been trending 0.5-0.7 percentage point below the year-over-year change in the core PCE.
Real Average Hourly Earnings fell 0.2% (+1.2% y/y), down 0.2% for production workers (+1.9% y/y).
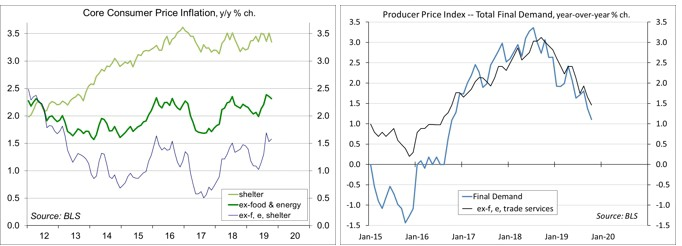
The Producer Price Index rose 0.4% in October, vs. -0.3% in September (+1.1% y/y). Wholesale gasoline prices rose 7.3% (+2.8% before seasonal adjustment, -16.3% y/y). Food rose 1.3% (+3.2% y/y). Trade services (which measure changes in margins received by wholesalers and retailers) rose 0.8% (+2.2% y/y). Transportation and warehousing services rose 0.3% (+0.5% y/y). Ex-food, energy, and trade services, the PPI 0.1% (+1.5% y/ y). Ex-food & energy, the price index for unprocessed intermediate goods fell 6.4% y/y, while the index for processed intermediate goods fell 2.4% y/y). The PPI figures do not include tariffs, but tariffs may be passed through to prices of finished goods.
Import Prices fell 0.5% in October (-3.0% y/y), reflecting a 3.7% decline in petroleum prices (-14.7% y/y). Ex-food & fuels, import prices fell 0.2% (-1.3% y/y). There remained no inflation in the prices of imported finished goods. These figures do not include tariffs.
Jobless Claims rose to 225,000 in the week ending November 9, vs. 211,000 in the previous week, but the weekly figures tend to be erratic during this time of year and the four-week average (at 217,000) remained low.
Treasury reported a $133 billion Federal Budget Deficit for October, the first month of FY20, up from $100.5 billion in October 2018.
Business Inventories were essentially unchanged in September (+3.7% y/y). Business sales fell 0.2% (+0.5% y/y). The inventory-to-sales ratio rose from 1.36 in September 2018 to 1.40 in September 2019. That likely reflects stockpiling ahead of tariff increases (most of the increase was in manufacturing and wholesale trade).
The Index of Small Business Optimism edged up to 102.4 in October, vs. 101.8 in September and 103.1 in August (the index peaked at 108.8 in August 2018). The general business outlook edged up. The earnings trend weakened. Hiring plans were moderate. Capital spending plans remained moderately strong.
The opinions offered by Dr. Brown should be considered a part of your overall decision-making process. For more information about this report – to discuss how this outlook may affect your personal situation and/or to learn how this insight may be incorporated into your investment strategy – please contact your financial advisor or use the convenient Office Locator to find our office(s) nearest you today.
All expressions of opinion reflect the judgment of the Research Department of Raymond James & Associates (RJA) at this date and are subject to change. Information has been obtained from sources considered reliable, but we do not guarantee that the foregoing report is accurate or complete. Other departments of RJA may have information which is not available to the Research Department about companies mentioned in this report. RJA or its affiliates may execute transactions in the securities mentioned in this report which may not be consistent with the report’s conclusions. RJA may perform investment banking or other services for, or solicit investment banking business from, any company mentioned in this report. For institutional clients of the European Economic Area (EEA): This document (and any attachments or exhibits hereto) is intended only for EEA Institutional Clients or others to whom it may lawfully be submitted. There is no assurance that any of the trends mentioned will continue in the future. Past performance is not indicative of future results.