Desperately Seeking Income
A long time ago in a galaxy far far away I began working on Wall Street. The year was 1971 and I had joined a small firm making markets in over-the-counter stocks and options. My salary was $100 a week and it was Camelot. Back then we were able to walk right off the American Stock Exchange trading floor, go down the stairs (there was no security) and into Harry’s at the Amex Bar and Grill. So every day, after the market closed, I would go to Harry’s, buy one drink (because that was all I could afford) and eat the steak frites for dinner, but I digress. In 1971 the markets opened at 10:00 a.m. and closed at 3:30 p.m. and every morning at 9:30 a.m. the traders would send me out for danish and coffee for the trading desk. So I walked by my boss’ office every morning at 9:30 a.m., but he was never in it because his own capital was at risk as the trade desk had inventories of stocks and options that needed to be watched closely. Interestingly, when I walked by his office, I noticed that there was a big red numerical 4 painted on his back wall above the credenza. After six months I finally summoned the courage to ask him what was the deal with the big red 4. He pushed his trading desk chair back from the trading desk, took a big long drag on an unfiltered Lucky Strike and said, in his heavy New York accent, “Kid, that’s the number of bear markets you will see in your career, don’t ever forget it!” And, I never forgot it, so let’s count; 1973 – 1974, 1980 – 1982, 2000 – 2002, and 2007 – 2009. How did he know in 1971 that I would see four bear markets in nearly 50 years in this business?
Making markets in OTC stocks was fun, but the real money was in options. In the early 1970s there were no option exchanges. There were only six option firms that made markets in “puts” and “calls.” It was a license to steal because you could find a call option writer who would buy 1,000 shares of IBM and sell us 10 call options struck at the current price that IBM shares were trading. Subsequently, we would find a buyer for those IBM call options and sell them for a $500 per option profit spread; poof, a $5,000 commission. My specialty was finding option writers. The most fertile ground was in Florida, where the retirees were “desperately seeking income.”
I revisit this option topic today because on my speaking tour last week in Fort Myers, Florida I spoke to the good folks at Capital Wealth Planning, LLC. The founder and president is Kevin Simpson, and over cocktails we disused his investment strategy. Said strategy is pretty simple. Capital Wealth Planning buys high-quality blue chip stocks with decent dividend yields, and then sells out of the money call options against those blue chip stocks. The objective is to attempt to provide their investors with a 6% – 7% cash flow return (the dividends plus the call option premiums) and any appreciation in the underlying stocks is just “gravy.” It is a pretty simple strategy, but it works. Indeed, it is one of the strategies I use to generate income as I move toward my retirement years. They are on the Raymond James platform and I have invested money with these folks. Verily, “desperately seeking income!”
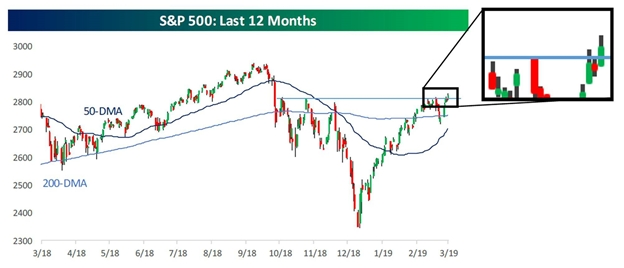
As for the equity markets, the S&P 500 (SPX/2822.48) closed above its March 4, 2019 intraday reaction high of 2816.88 last week, causing many pundits to suggest an upside breakout. I am not so sure and continue to use the 2800 – 2830 zone as the valid upside resistance zone. Last week was the fourth attempt to better that zone. Our work shows another “polarity flip” due this week with the potential of a pause, or a pullback attempt, which should be small. Following that, the path of least resistance should be on the upside again. It is worth noting that while the SPX had an upside breakout above its March 3, 2019 intraday high, the D-J Industrials (INDU/25848.87) were held back by the Boeing consternation. As Bespoke writes:
All the index had to do was breakout above those former highs around 2,820, and that would be the green light to everyone that the correction was over. It’s never that easy, though. On Friday, the S&P 500 finally did break out above 2,820, but can you imagine it doing so in a less convincing way? Sure, this week’s rally was very impressive, but it only figures that the momentum would slow just as we reached the breakout level. There were no fireworks and streamers included with this one, and we may not have even noticed the move if we hadn’t zoomed in on the chart to more than 300%! Just kidding. We were watching it all day (chart 1 on the next page)!
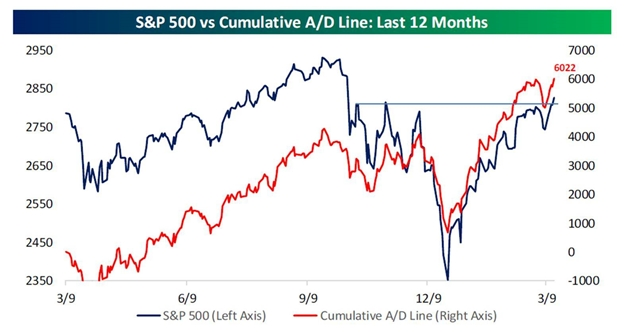
As I have written, the positives vastly outweigh the negatives, the FOMC looks to be on hold, while the economic momentum seems to be slowing it is still not signaling a recession, and the Advance-Decline Line continues to point the way higher (chart 2 on page 3). And it is not just the U.S. markets, but ALL of the worldwide equity-centric ETFs I monitor closed higher last week. Among the U.S. indices, the NASDAQ was up more than 4% last week, but the other ETF index-centric indices were better by 1.4%+. Unfortunately, such strength left all of the indices I monitor above their respect 50-day moving averages (DMAs) and therefore pretty overbought on a short-term basis. As stated, “Our work shows another ‘polarity flip’ due this week with the potential of a pause, or a pullback attempt, which should be small. Following that, the path of least resistance should be on the upside again.”
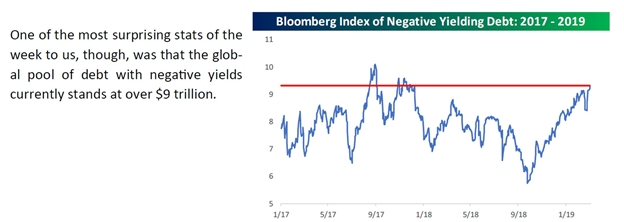
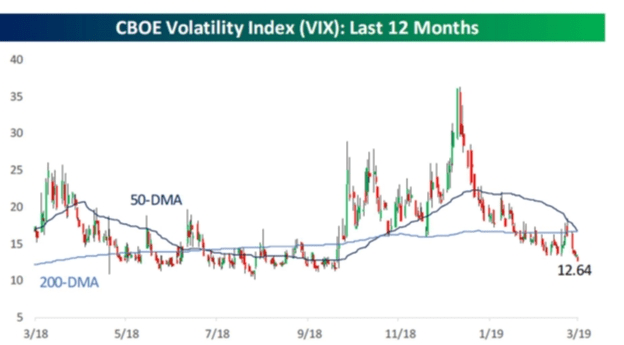
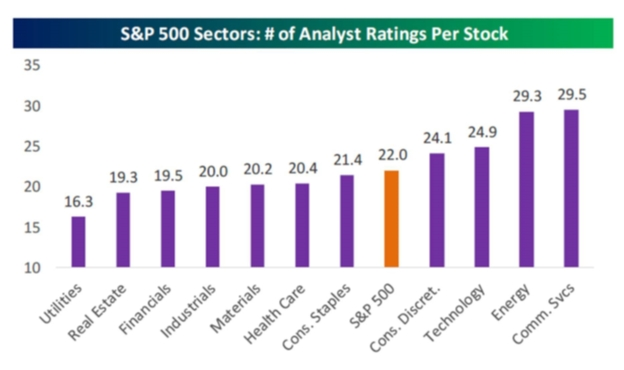
Also of interest is the yields on various bond issues as the yield on the 10-year T’note fell below 2.60% last week. Quite amazingly, there is $9 trillion worth of global debt still trading with negative yields (chart 3). Meanwhile, bullish stock sentiment has declined from 37.39 to 32.42, while bearish sentiment has risen (chart 4 on page 4), so there remains a healthy dose of skepticism out there. Also reinforcing my very short-term “cautionary call” is that the Volatility Index (VIX/12.88) traded at a low for the first time in 100 sessions (chart 5). As for sectors, chart 6 (on page 5) shows the number of positive fundamental analysts’ ratings by sector. Obviously I continue to like the Energy sector with particular emphasis on the midstream master limited partnership names with positive ratings from our energy analysts.
The call for this week: So last week I was asked why, since I remain extremely bullish, I have not recommended any stocks recently. My answer to that email read something like:
In my letter, I recommended a number of stocks when the S&P 500 was in the mid/low 2700s. However, in the 2800 – 2830 overhead resistance zone I am not so sure you should be aggressively buying trading positions. I believe investment positions should be accumulated in out of favor sectors like midstream MLPs. I also believe the financials should be bought – please see our equity research for fundamental recommendations or check with our mutual fund team for appropriate vehicles. This week the FOMC meets on Tuesday and Wednesday. No change in policy or message is expected. But bulls hope for a dovish FOMC communique. Of interest is that the option and futures’ expiry last Friday typically generates a peak in momentum; and stocks usually decline in the ensuing week. This week’s FOMC meeting might usurp this decline because traders expect a dovish communique; however, my work suggests a “polarity flip.”
This morning the preopening S&P 500 futures are relatively flat on no real overnight news.
Additional information is available on request. This document may not be reprinted without permission.
Raymond James & Associates may make a market in stocks mentioned in this report and may have managed/co-managed a public/follow-on offering of these shares or otherwise provided investment banking services to companies mentioned in this report in the past three years.
RJ&A or its officers, employees, or affiliates may 1) currently own shares, options, rights or warrants and/or 2) execute transactions in the securities mentioned in this report that may or may not be consistent with this report’s conclusions.
The opinions offered by Mr. Saut should be considered a part of your overall decision-making process. For more information about this report – to discuss how this outlook may affect your personal situation and/or to learn how this insight may be incorporated into your investment strategy – please contact your Raymond James Financial Advisor.
All expressions of opinion reflect the judgment of the Equity Research Department of Raymond James & Associates at this time and are subject to change. Information has been obtained from sources considered reliable, but we do not guarantee that the material presented is accurate or that it provides a complete description of the securities, markets or developments mentioned. Other Raymond James departments may have information that is not available to the Equity Research Department about companies mentioned. We may, from time to time, have a position in the securities mentioned and may execute transactions that may not be consistent with this presentation’s conclusions. We may perform investment banking or other services for, or solicit investment banking business from, any company mentioned. Investments mentioned are subject to availability and market conditions. All yields represent past performance and may not be indicative of future results. Raymond James & Associates, Raymond James Financial Services and Raymond James Ltd. are wholly-owned subsidiaries of Raymond James Financial.
International securities involve additional risks such as currency fluctuations, differing financial accounting standards, and possible political and economic instability. These risks are greater in emerging markets.
Investors should consider the investment objectives, risks, and charges and expenses of mutual funds carefully before investing. The prospectus contains this and other information about mutual funds. The prospectus is available from your financial advisor and should be read carefully before investing.


