2 Quarter 2018 GDP
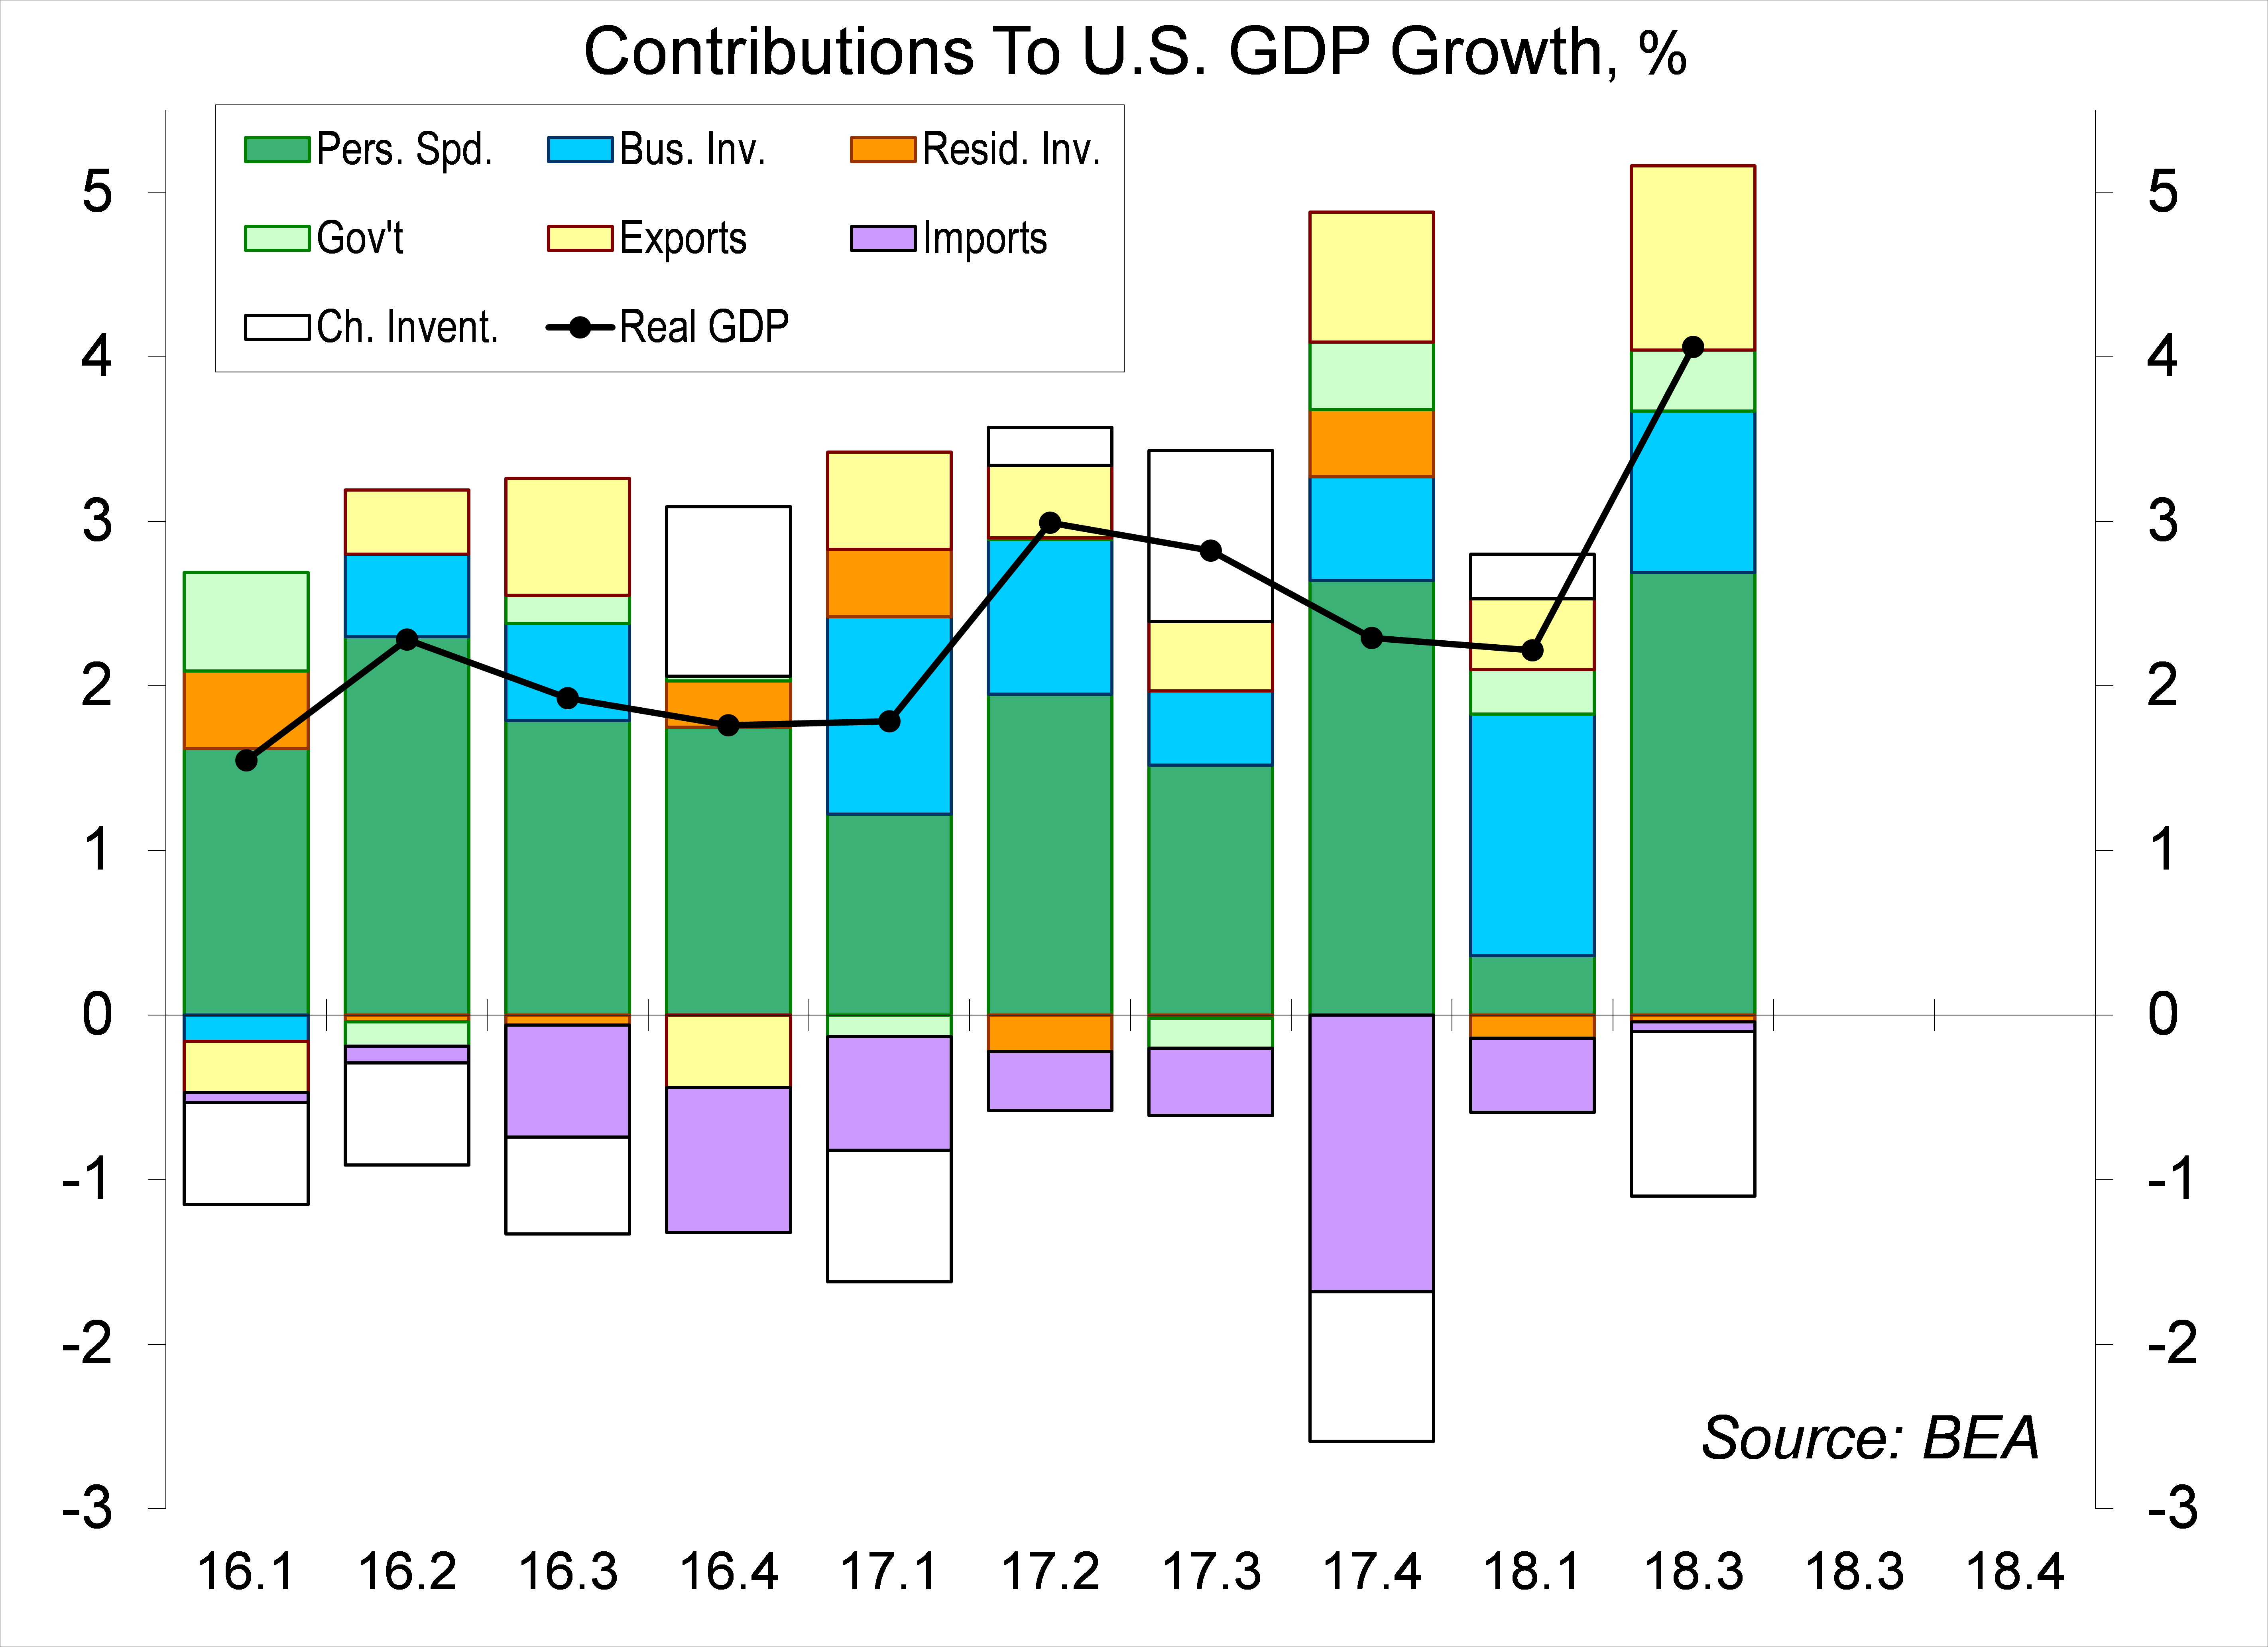
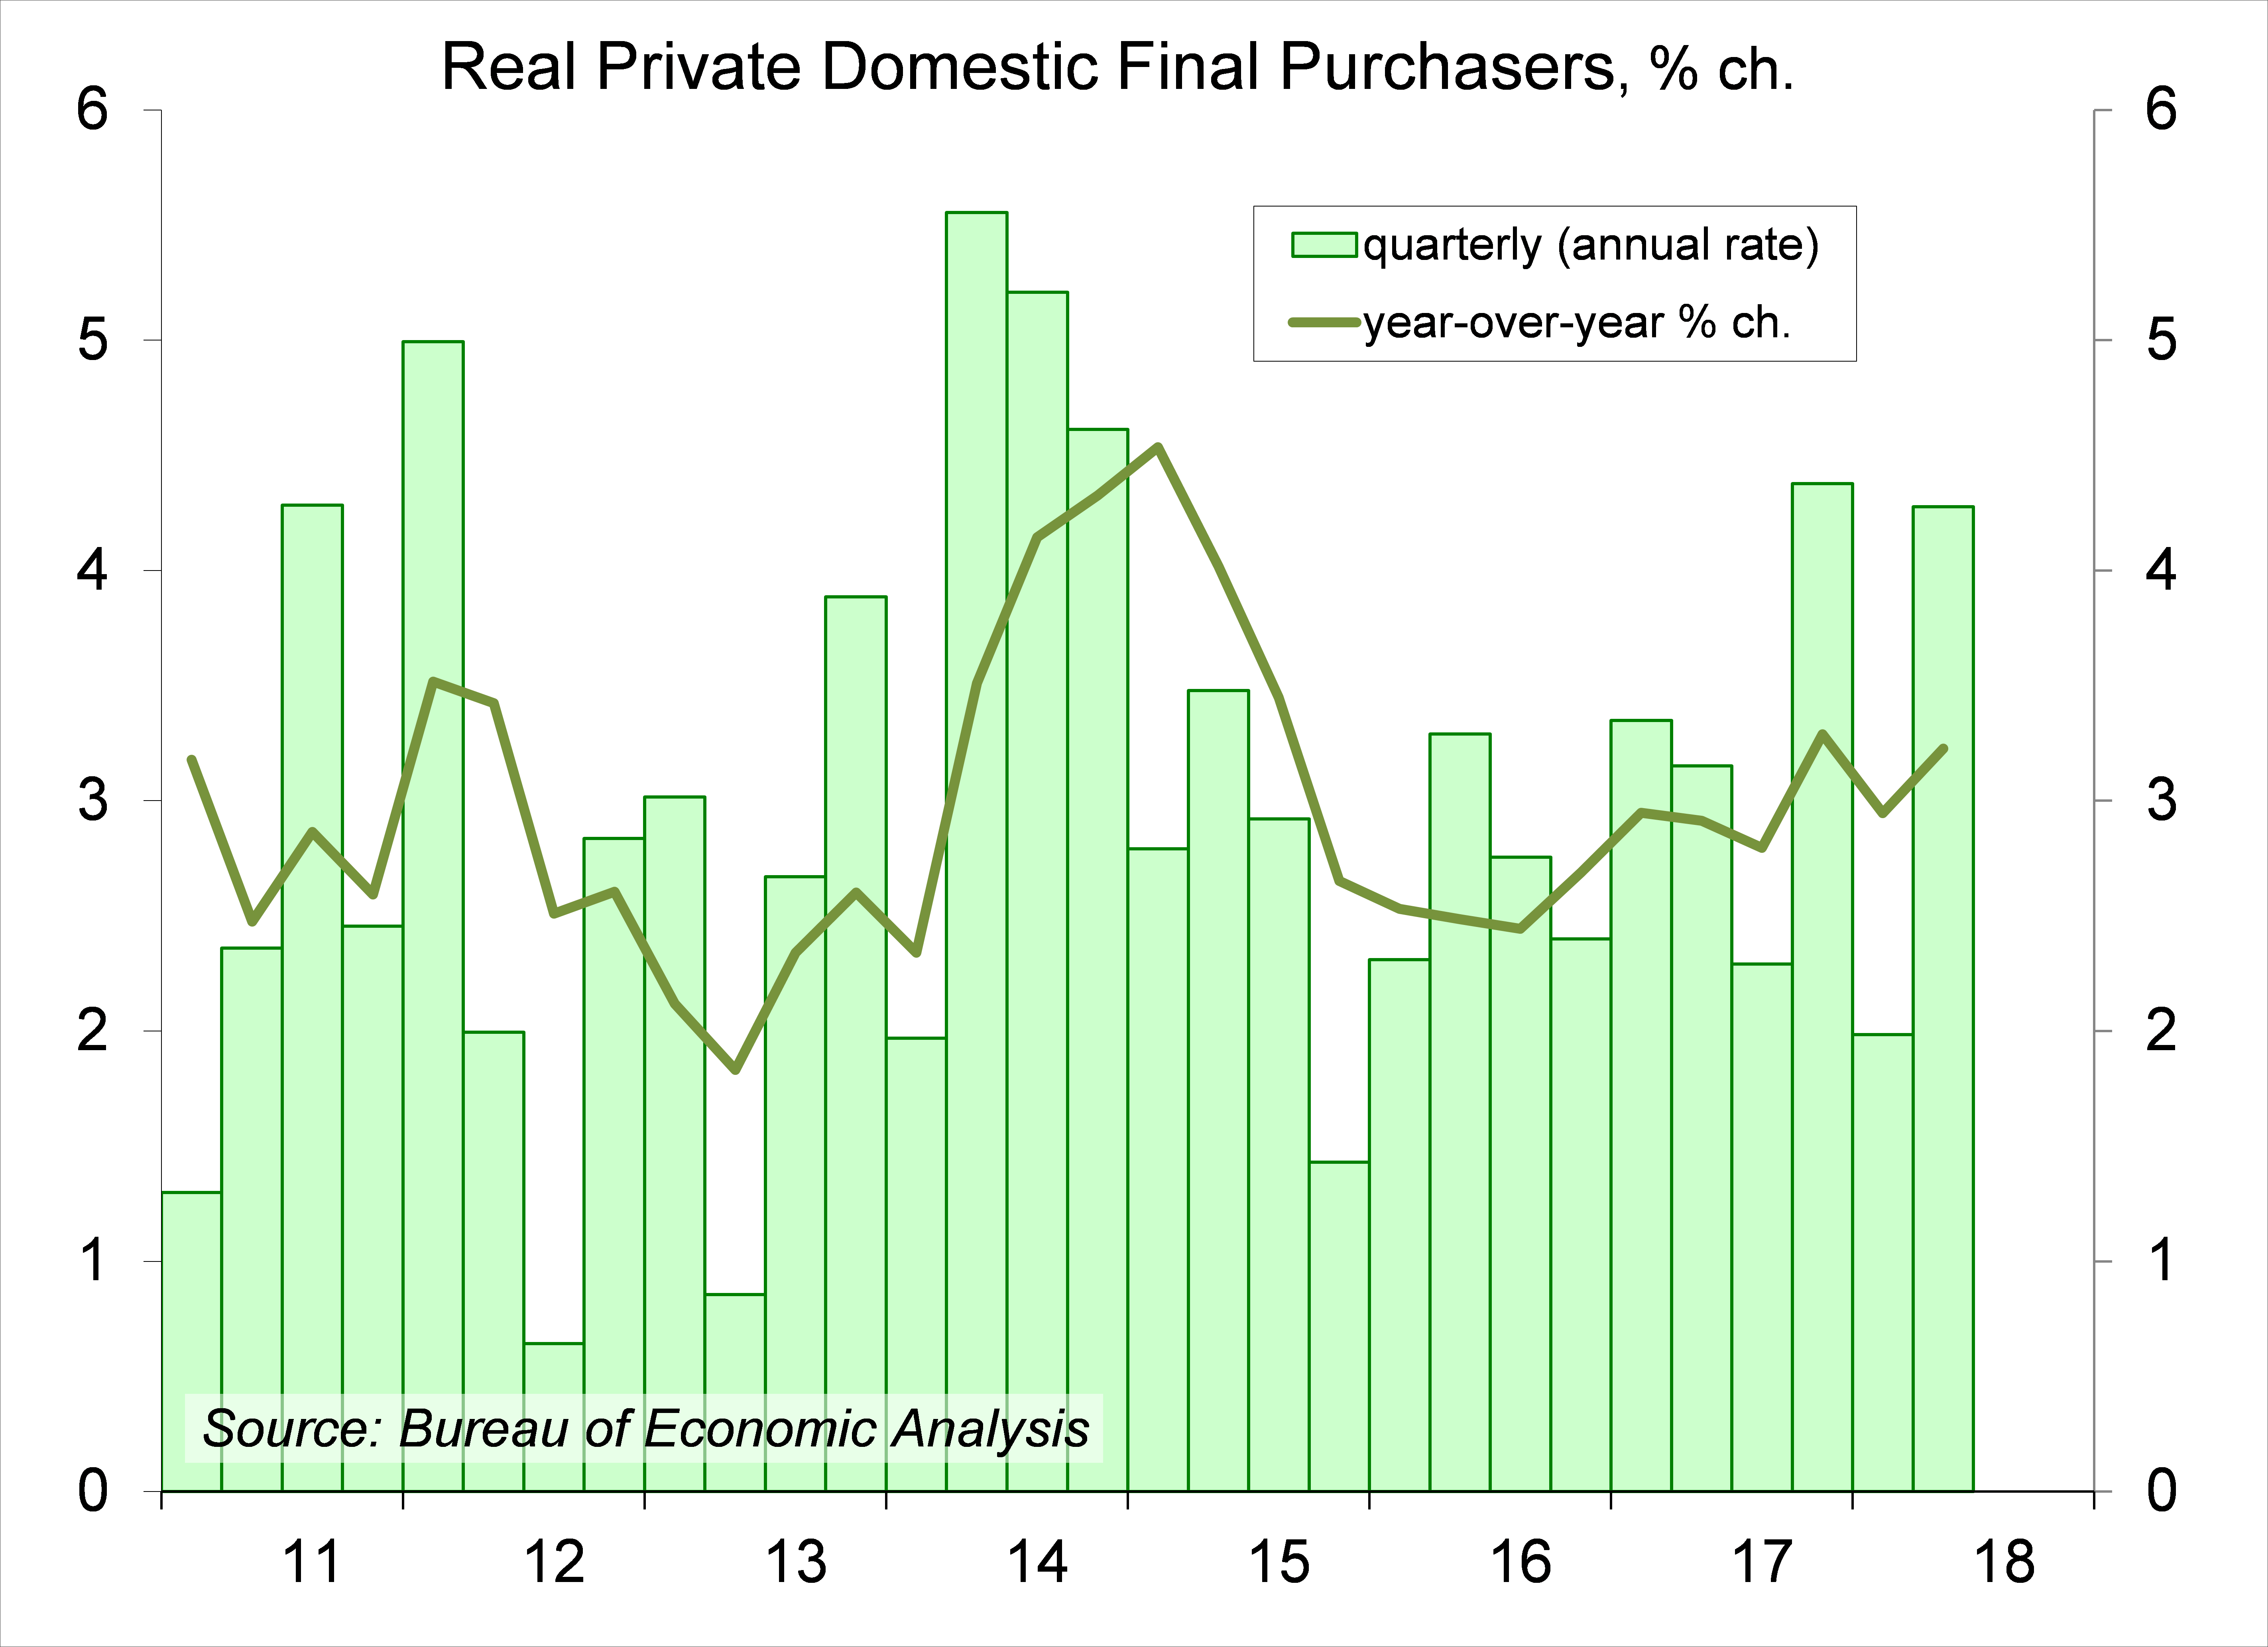
Real GDP rose at a 4.1%, annual rate in the advance estimate for 2Q18, about as anticipated. That followed a 2.2% pace in the first quarter (revised from +2.0%). Second quarter strength was concentrated in consumer spending (rebounding from a soft 1Q18) and a surge in agricultural exports (which may have been in anticipation of an escalation in trade tensions). Private Domestic Final Purchases (GDP ex-foreign trade, inventories, and government), the preferred measure of underlying private-sector domestic demand, rose at a 4.3% annual rate, vs. +2.0% in 1Q18 – averaging a 3.1% pace for the first half of the year (up 3.2% y/y). For Federal Reserve policymakers, this trend is well beyond a long-term sustainable pace, consistent with further increases in short-term interest rates. Growth is expected to slow in the second half of the year, but it’s uncertain by how much.
Chart 1
Chart 2
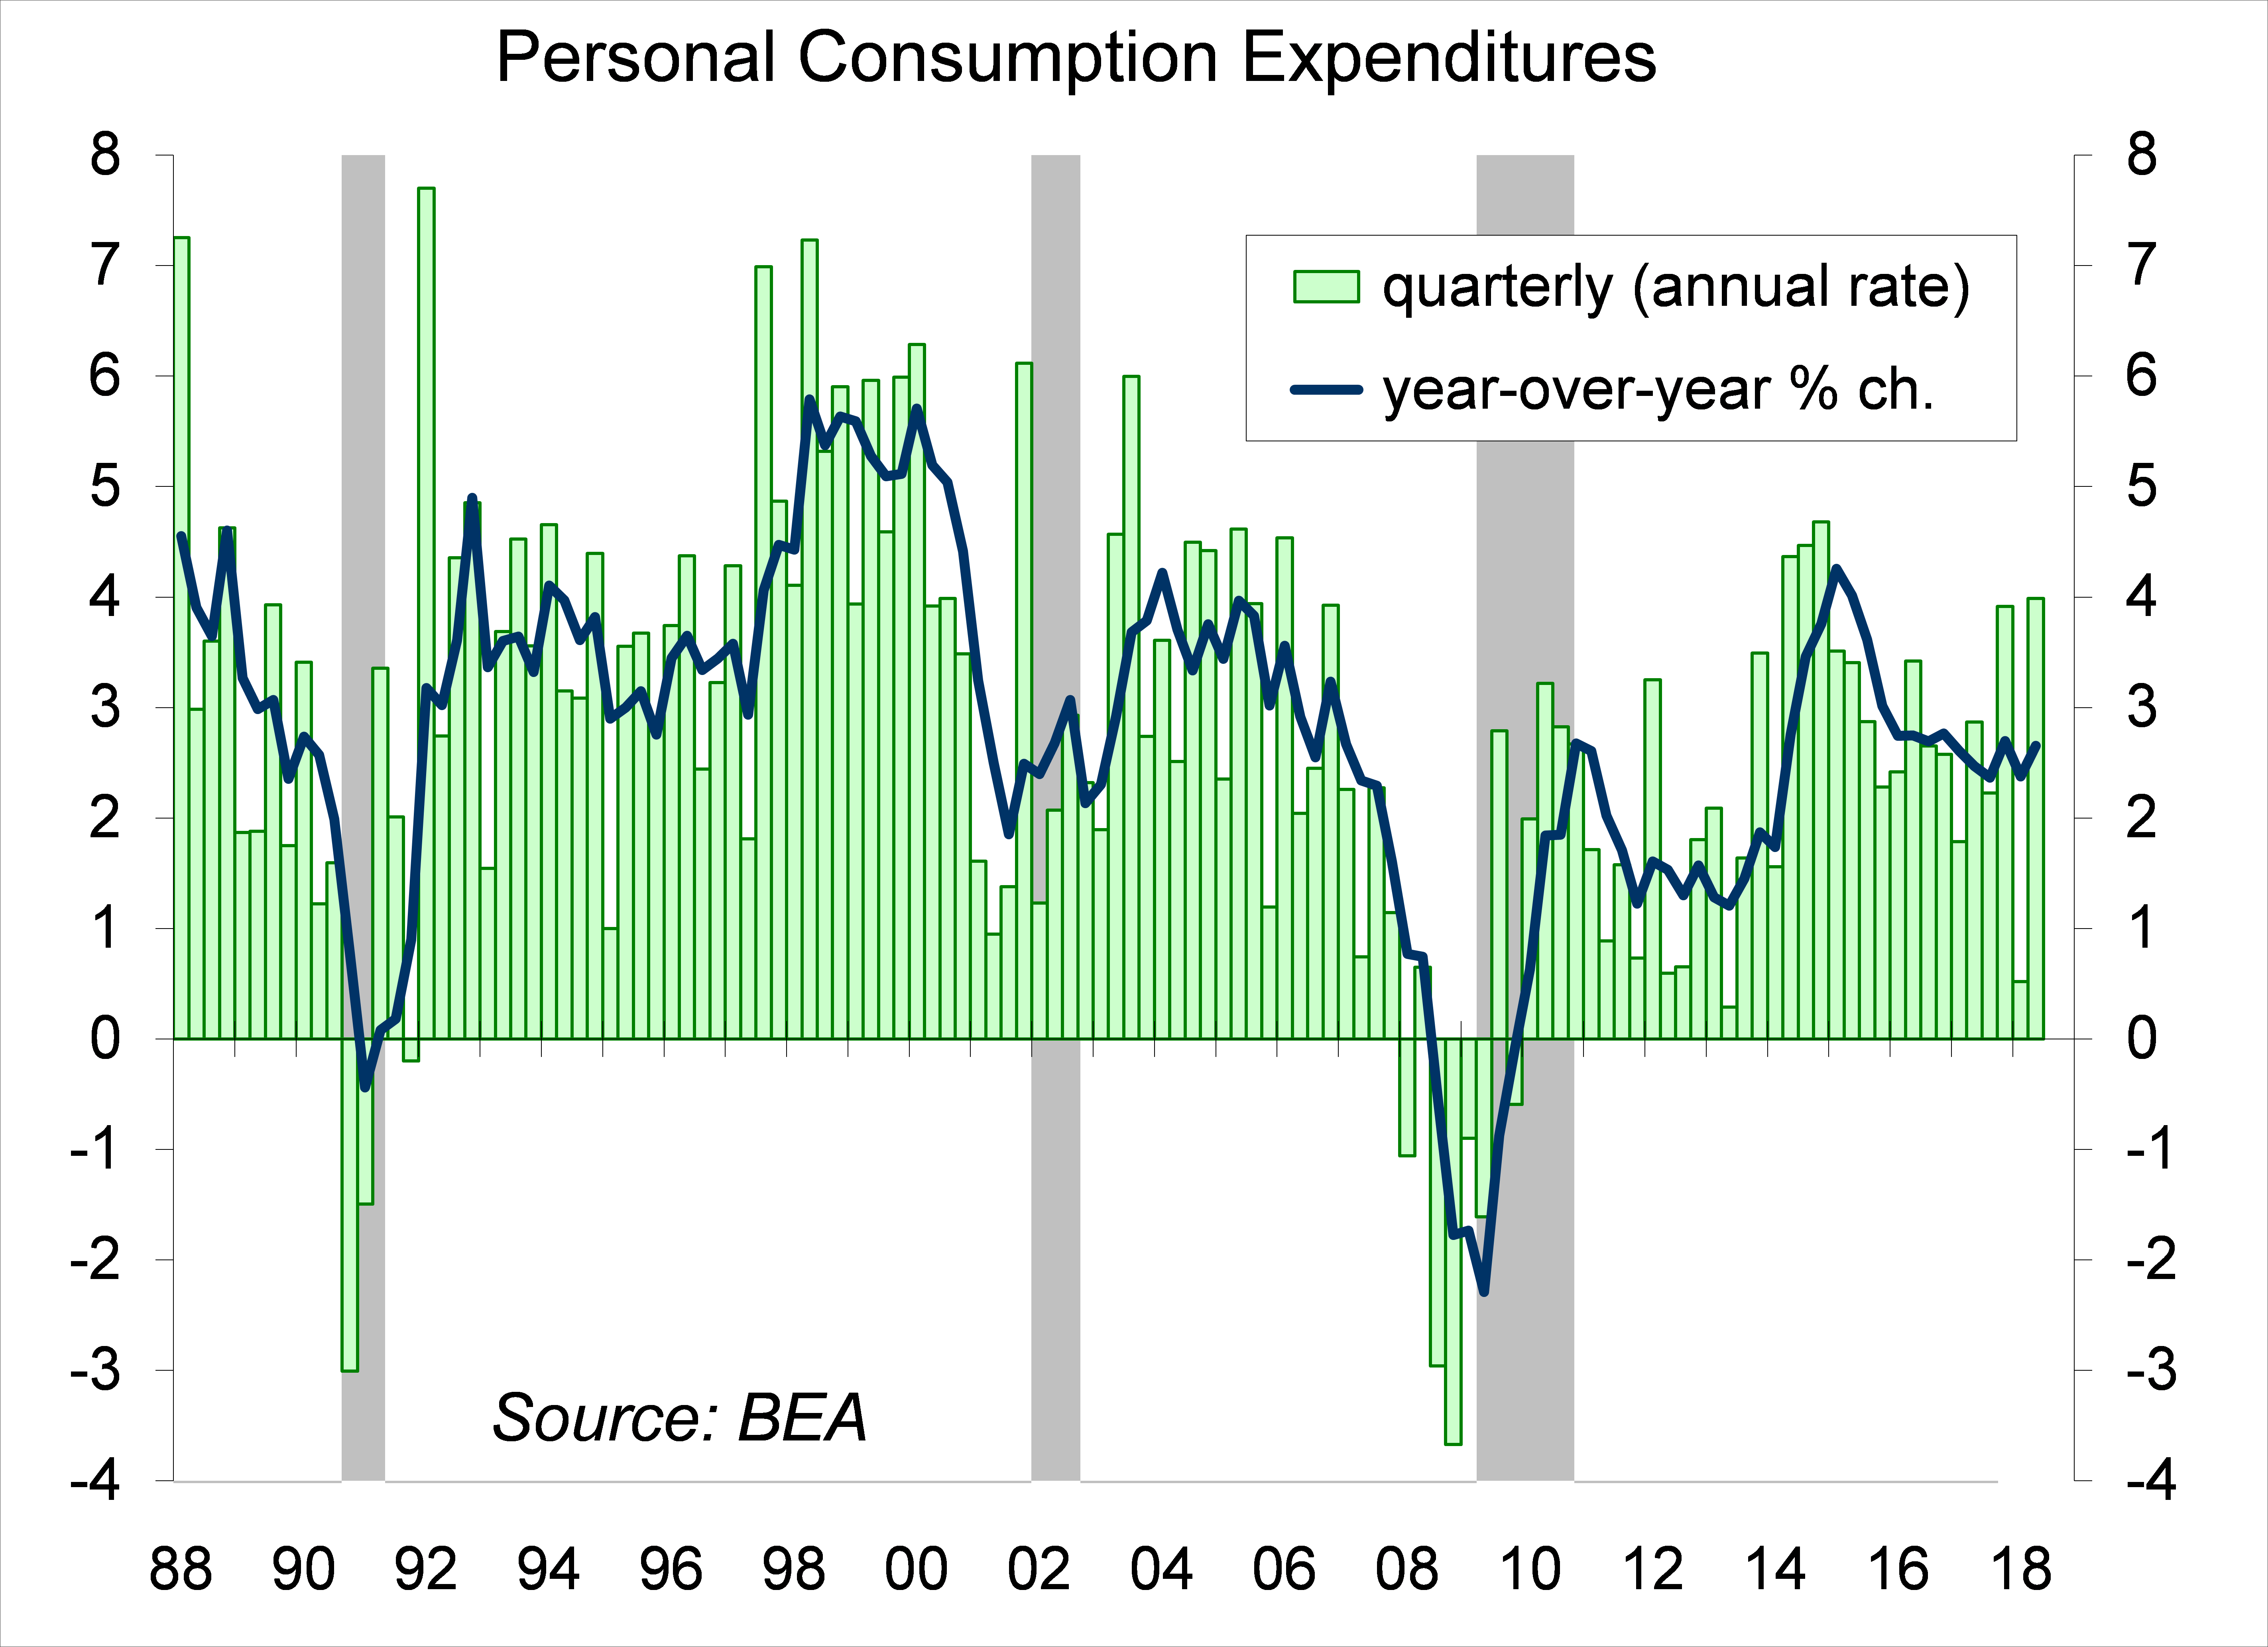
Consumer spending, which accounts for 68% of Gross Domestic Product, is the key component in the economic outlook. Consumer spending rose at a 4.0% annual rate in 2Q18, vs. +0.5% in 1Q18 (revised from +0.9%). That averages to a 2.2% annual rate in the first half of the year (vs. +3.2% in the second half of 2017). Real wage growth has been about flat year-over-year. That implies limited fuel for consumer spending growth over the near term. Average hourly earnings are up about 2.7% y/y. The CPI rose 2.9% over the 12 months ending in June (reflecting higher gasoline prices), but core inflation is somewhat more moderate (+2.3% y/y).
Chart 3
Chart 4
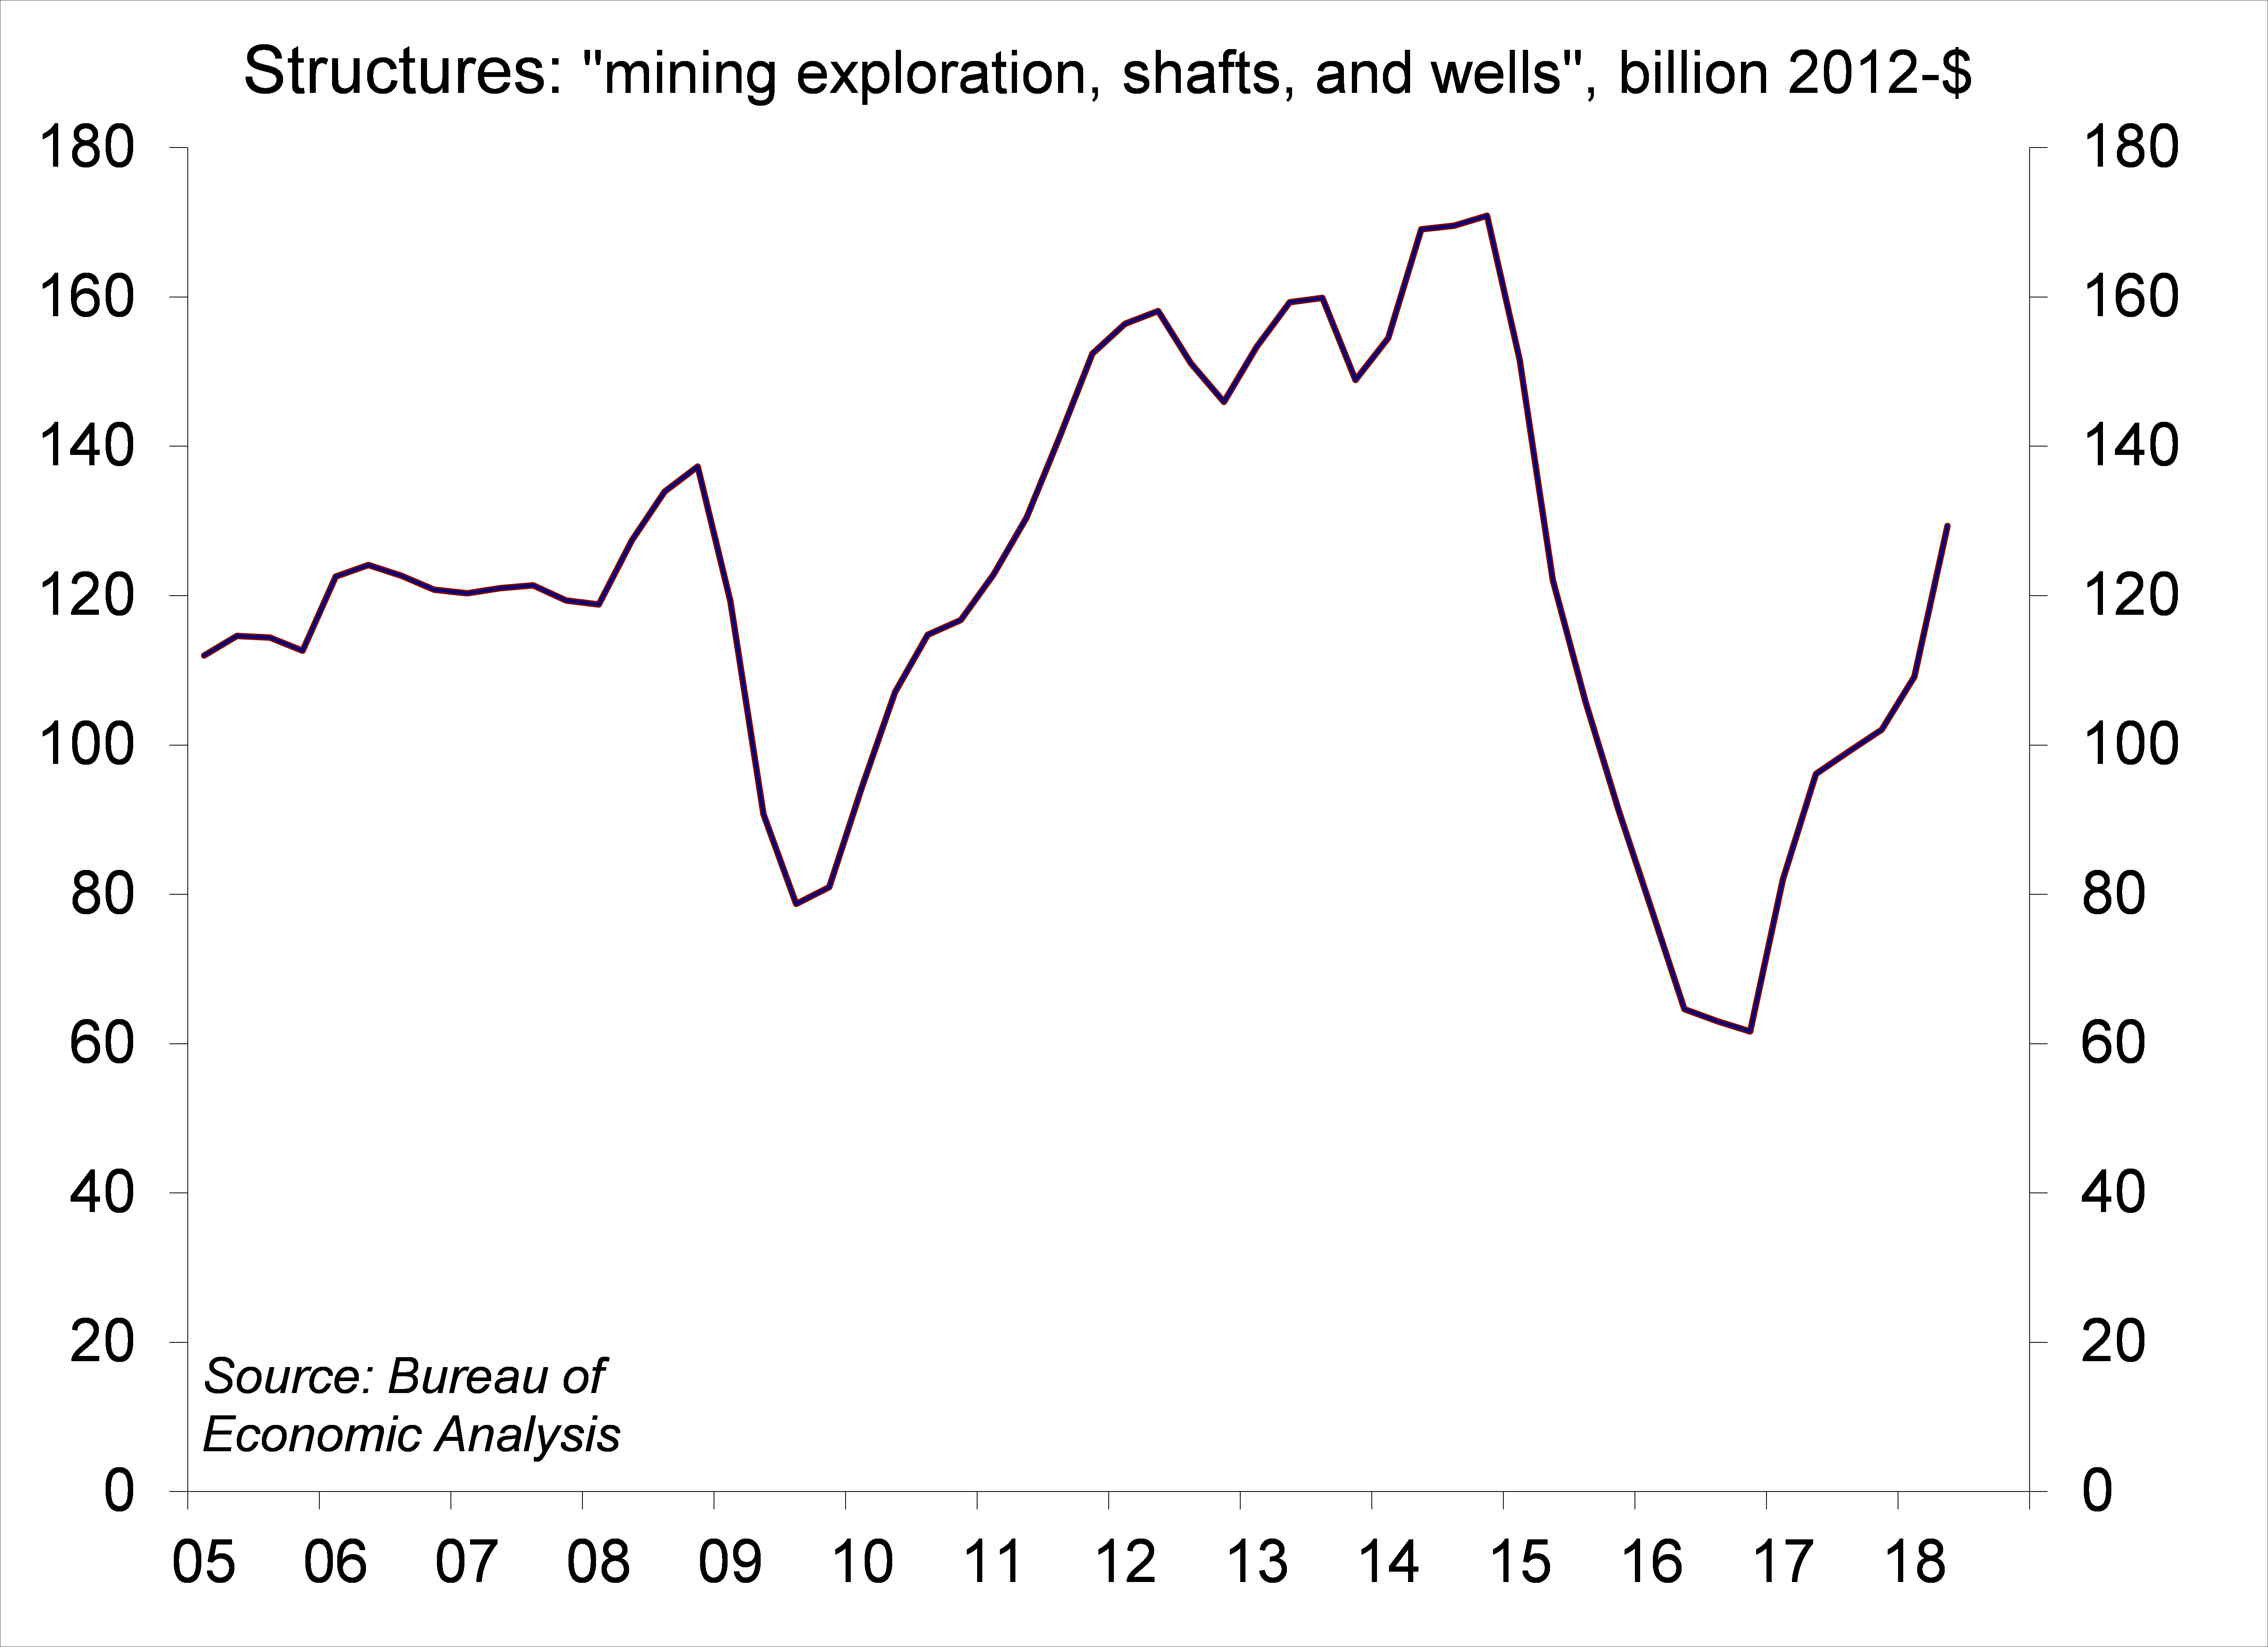
Business fixed investment rose at a 7.3% annual rate in 2Q18, vs. +11.5% in 1Q18. Strength continued in structures, reflecting the recovery in energy exploration (mining, exploration, shafts & wells +97.1%). Intellectual property products (software +6.6%, research and development +10.9%, entertainment +0.9%), but investment in equipment was mixed (info-processing equipment 12.3%, industrial equipment -5.3%, transportation equipment -1.4%). Data on durable goods orders showed a pickup in orders for nondefense capital goods ex-aircraft in 2Q18, which suggest that the lull in equipment spending may be temporary.
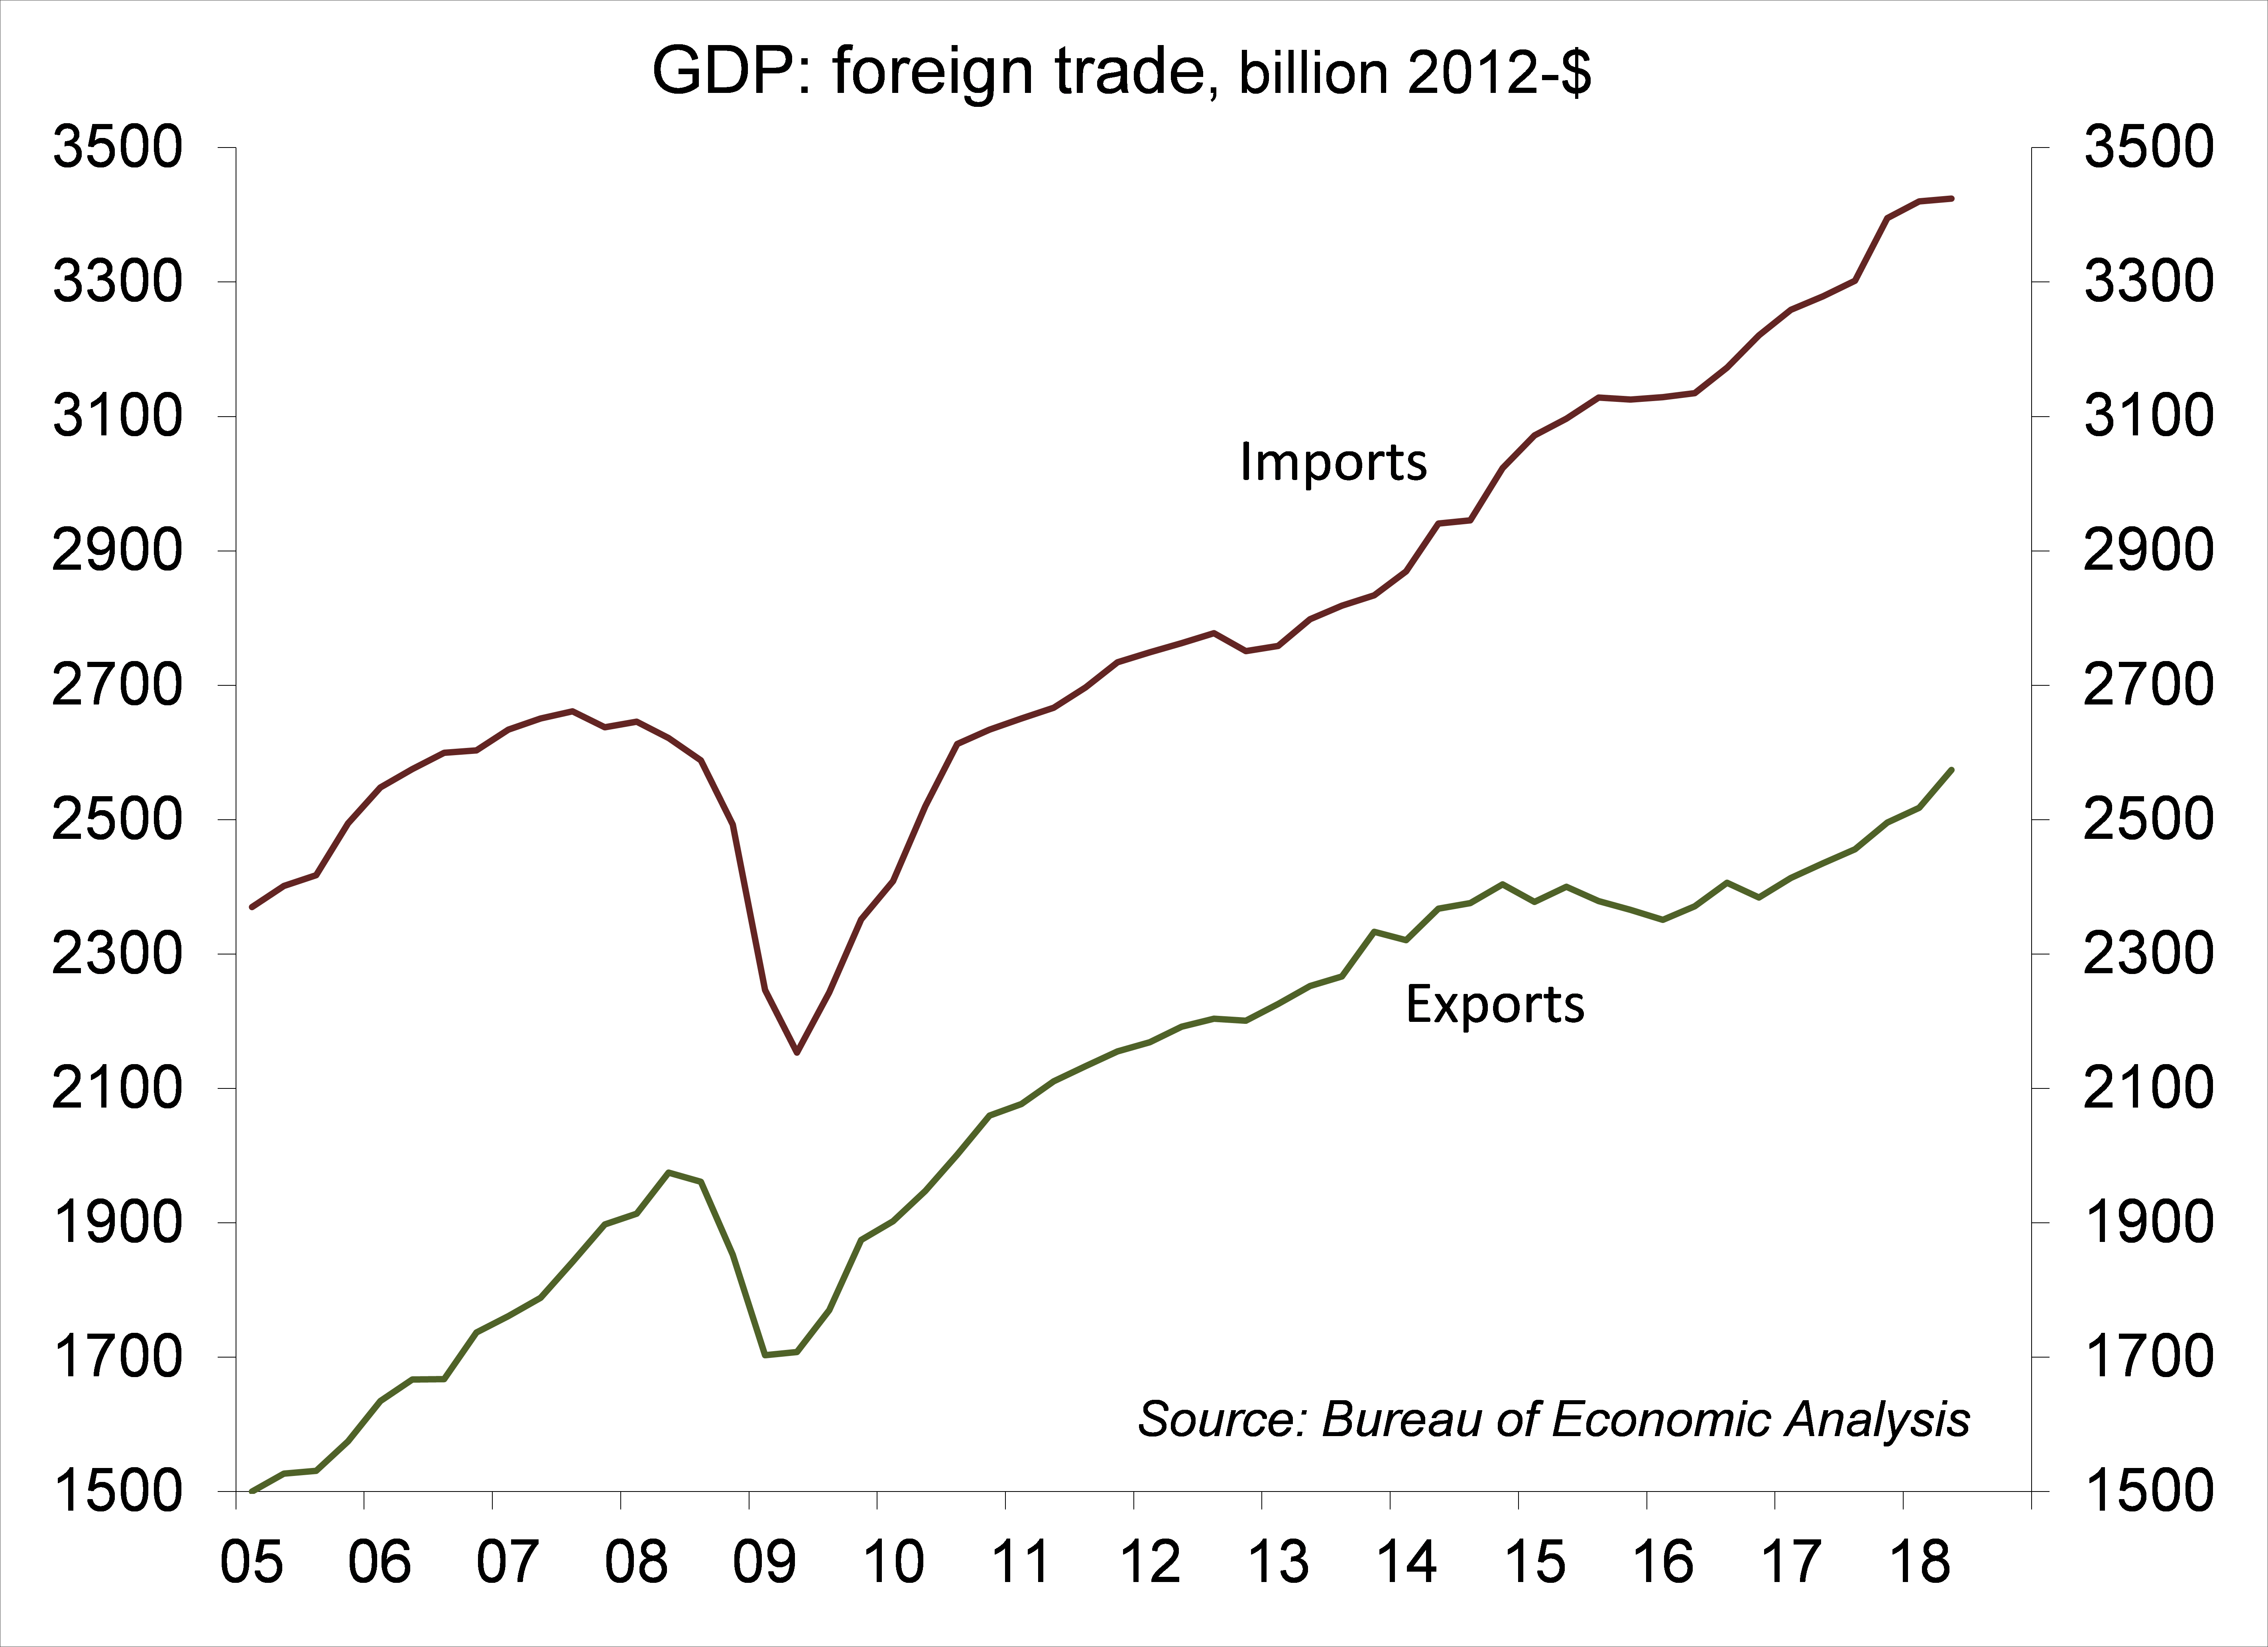
Net exports (a narrower trade deficit) added more than a full percentage point to overall GDP growth in 2Q18. Imports, which had risen sharply in 4Q17, slowed. Don’t read too much into that. Quarterly trade figures are choppy. Exports rose sharply. Foods, feeds, and beverages rose at a 110.5% annual rate, presumably reflecting a jump in soybean exports. That’s likely to reverse in the third quarter, subtracting from GDP. It’s unclear what the impact of higher tariffs will have on the GDP numbers. Trade decisions don’t turn on a dime and changes to the figures will happen over time.
Chart 5
Chart 6
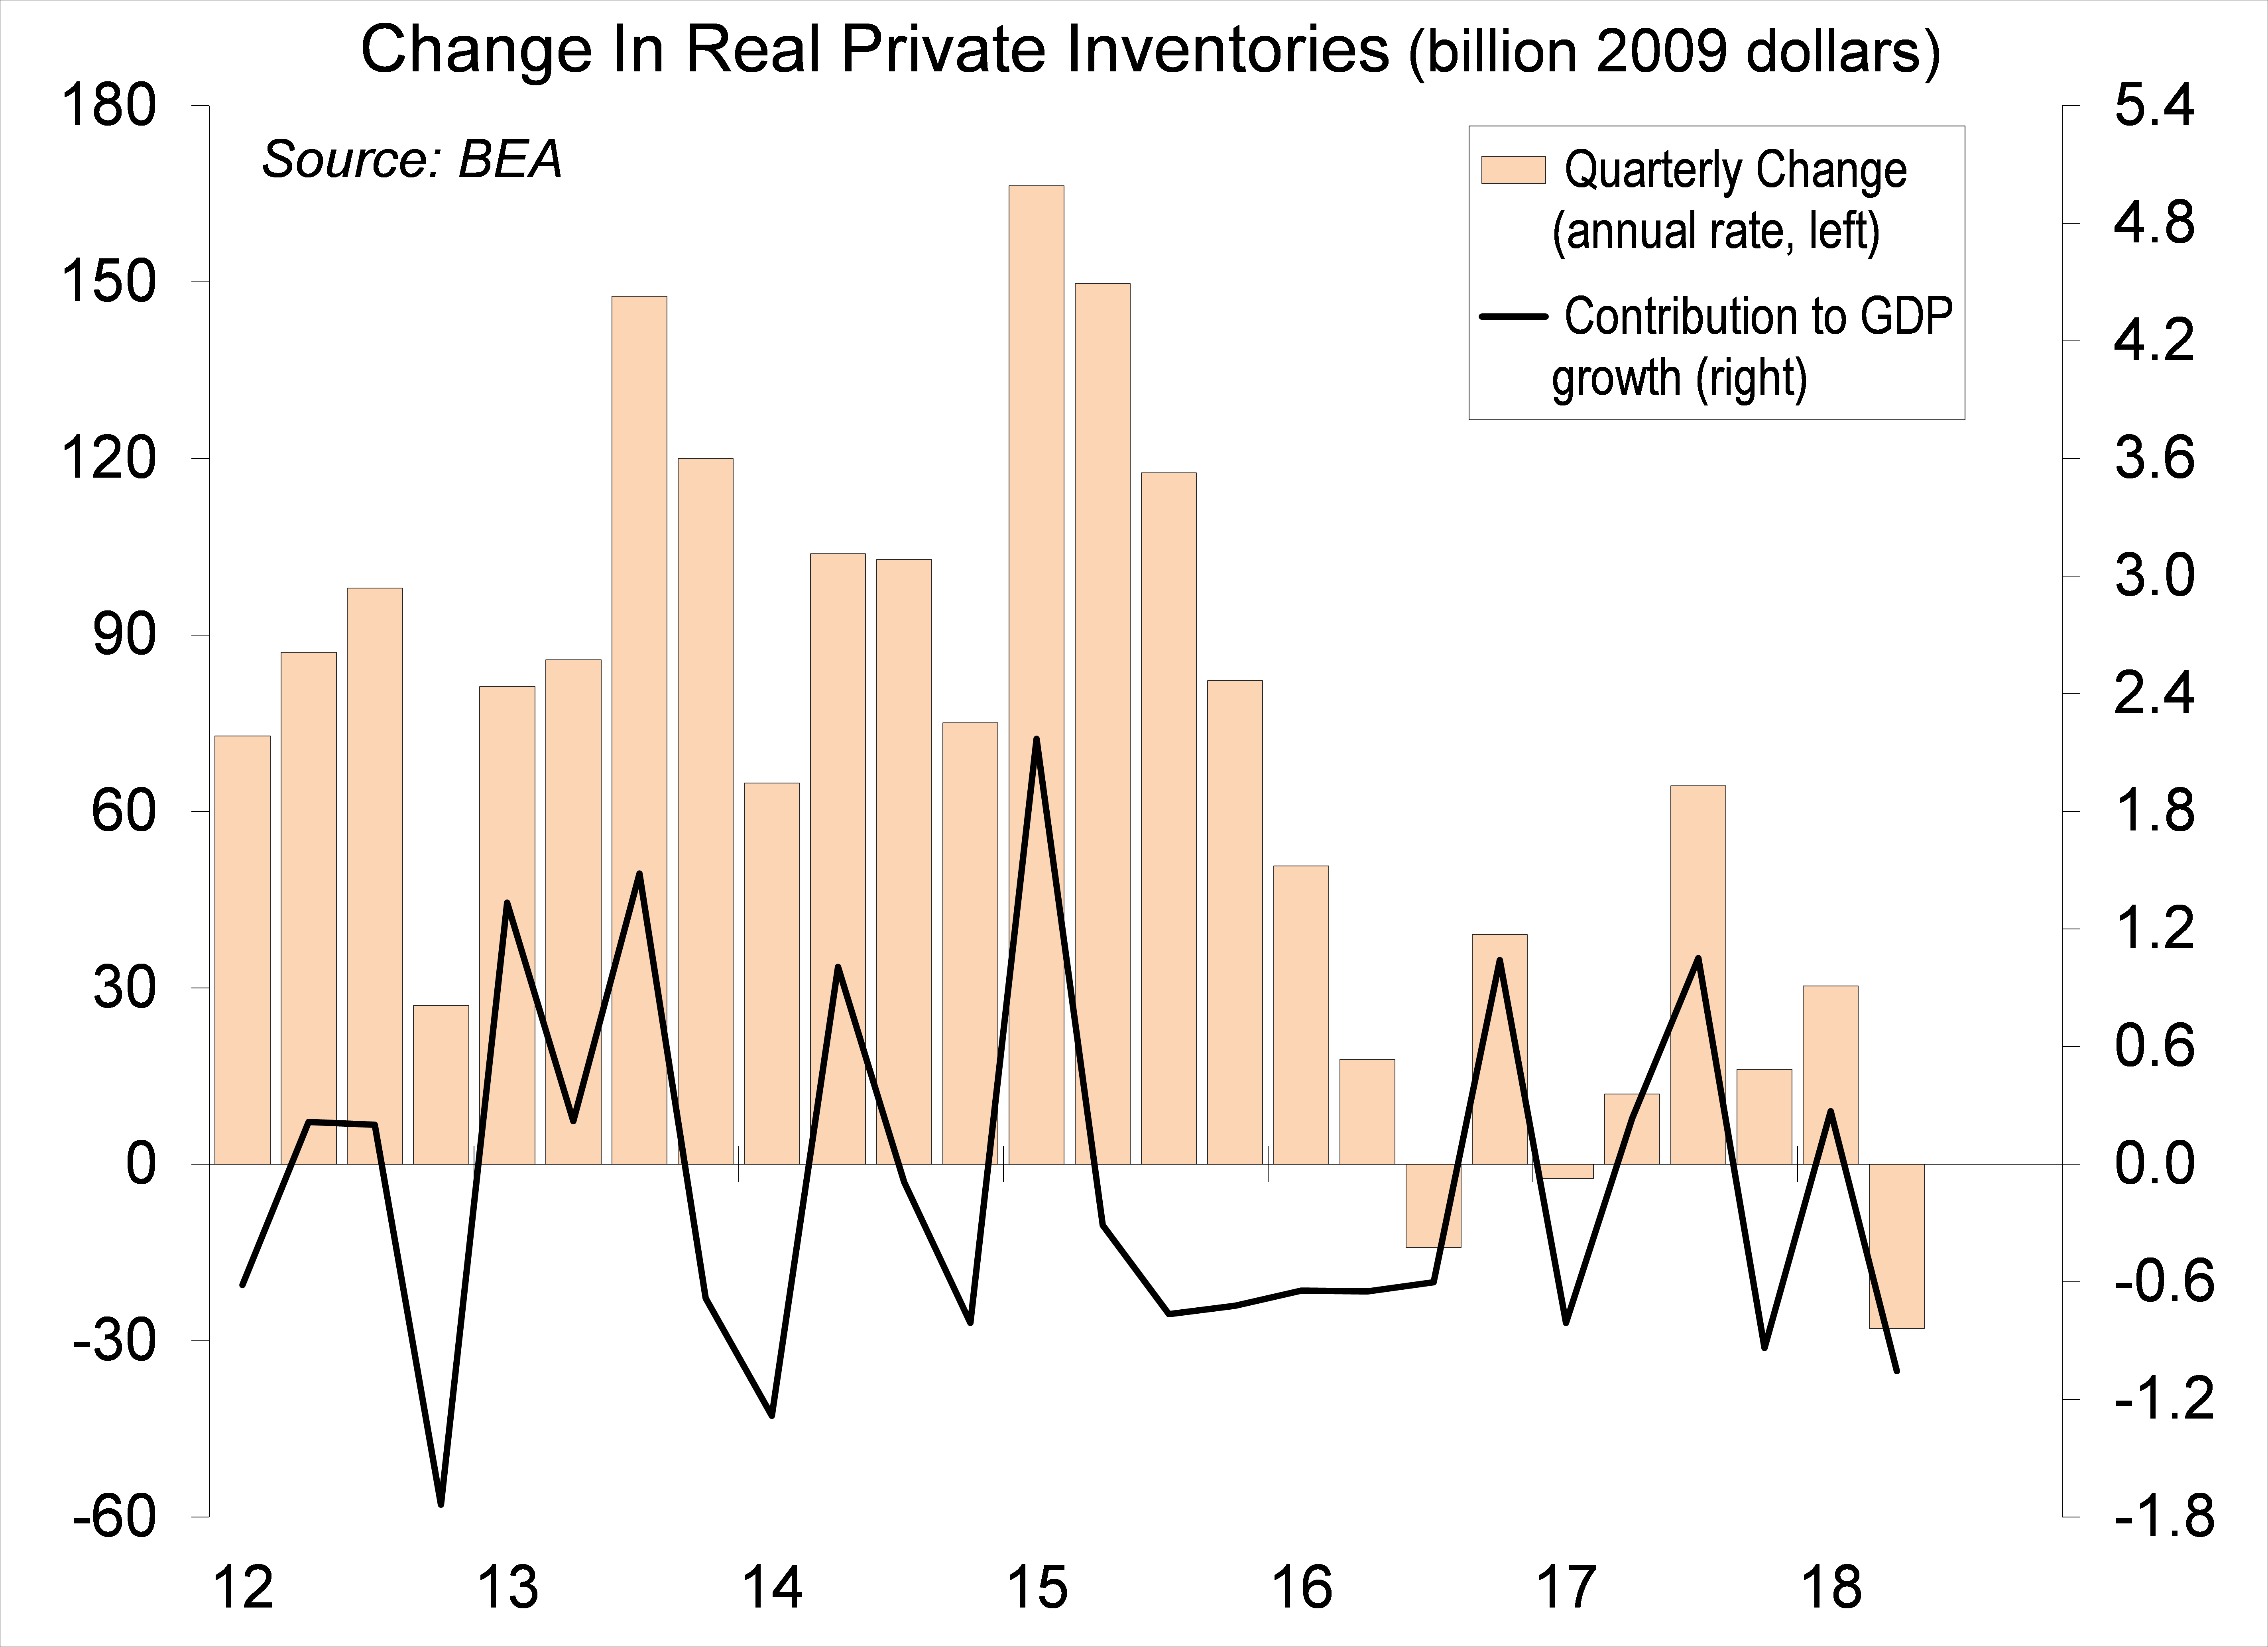
Inventories rose at a slower pace in the second quarter. Recall (from Econ 1) that inventories are a stock ($) and GDP is a flow ($/time). The change in inventories contributes to the level of GDP, while the change in the change in inventories contributes to GDP growth. In other words, a slower pace of inventory growth subtracts from GDP growth and a faster pace adds. The slower pace of inventory growth in 2Q18 could be unintentional – that is, reflective of stronger-than-expected demand. The pace is likely to pick up in the remainder of the year, adding somewhat to overall GDP growth.
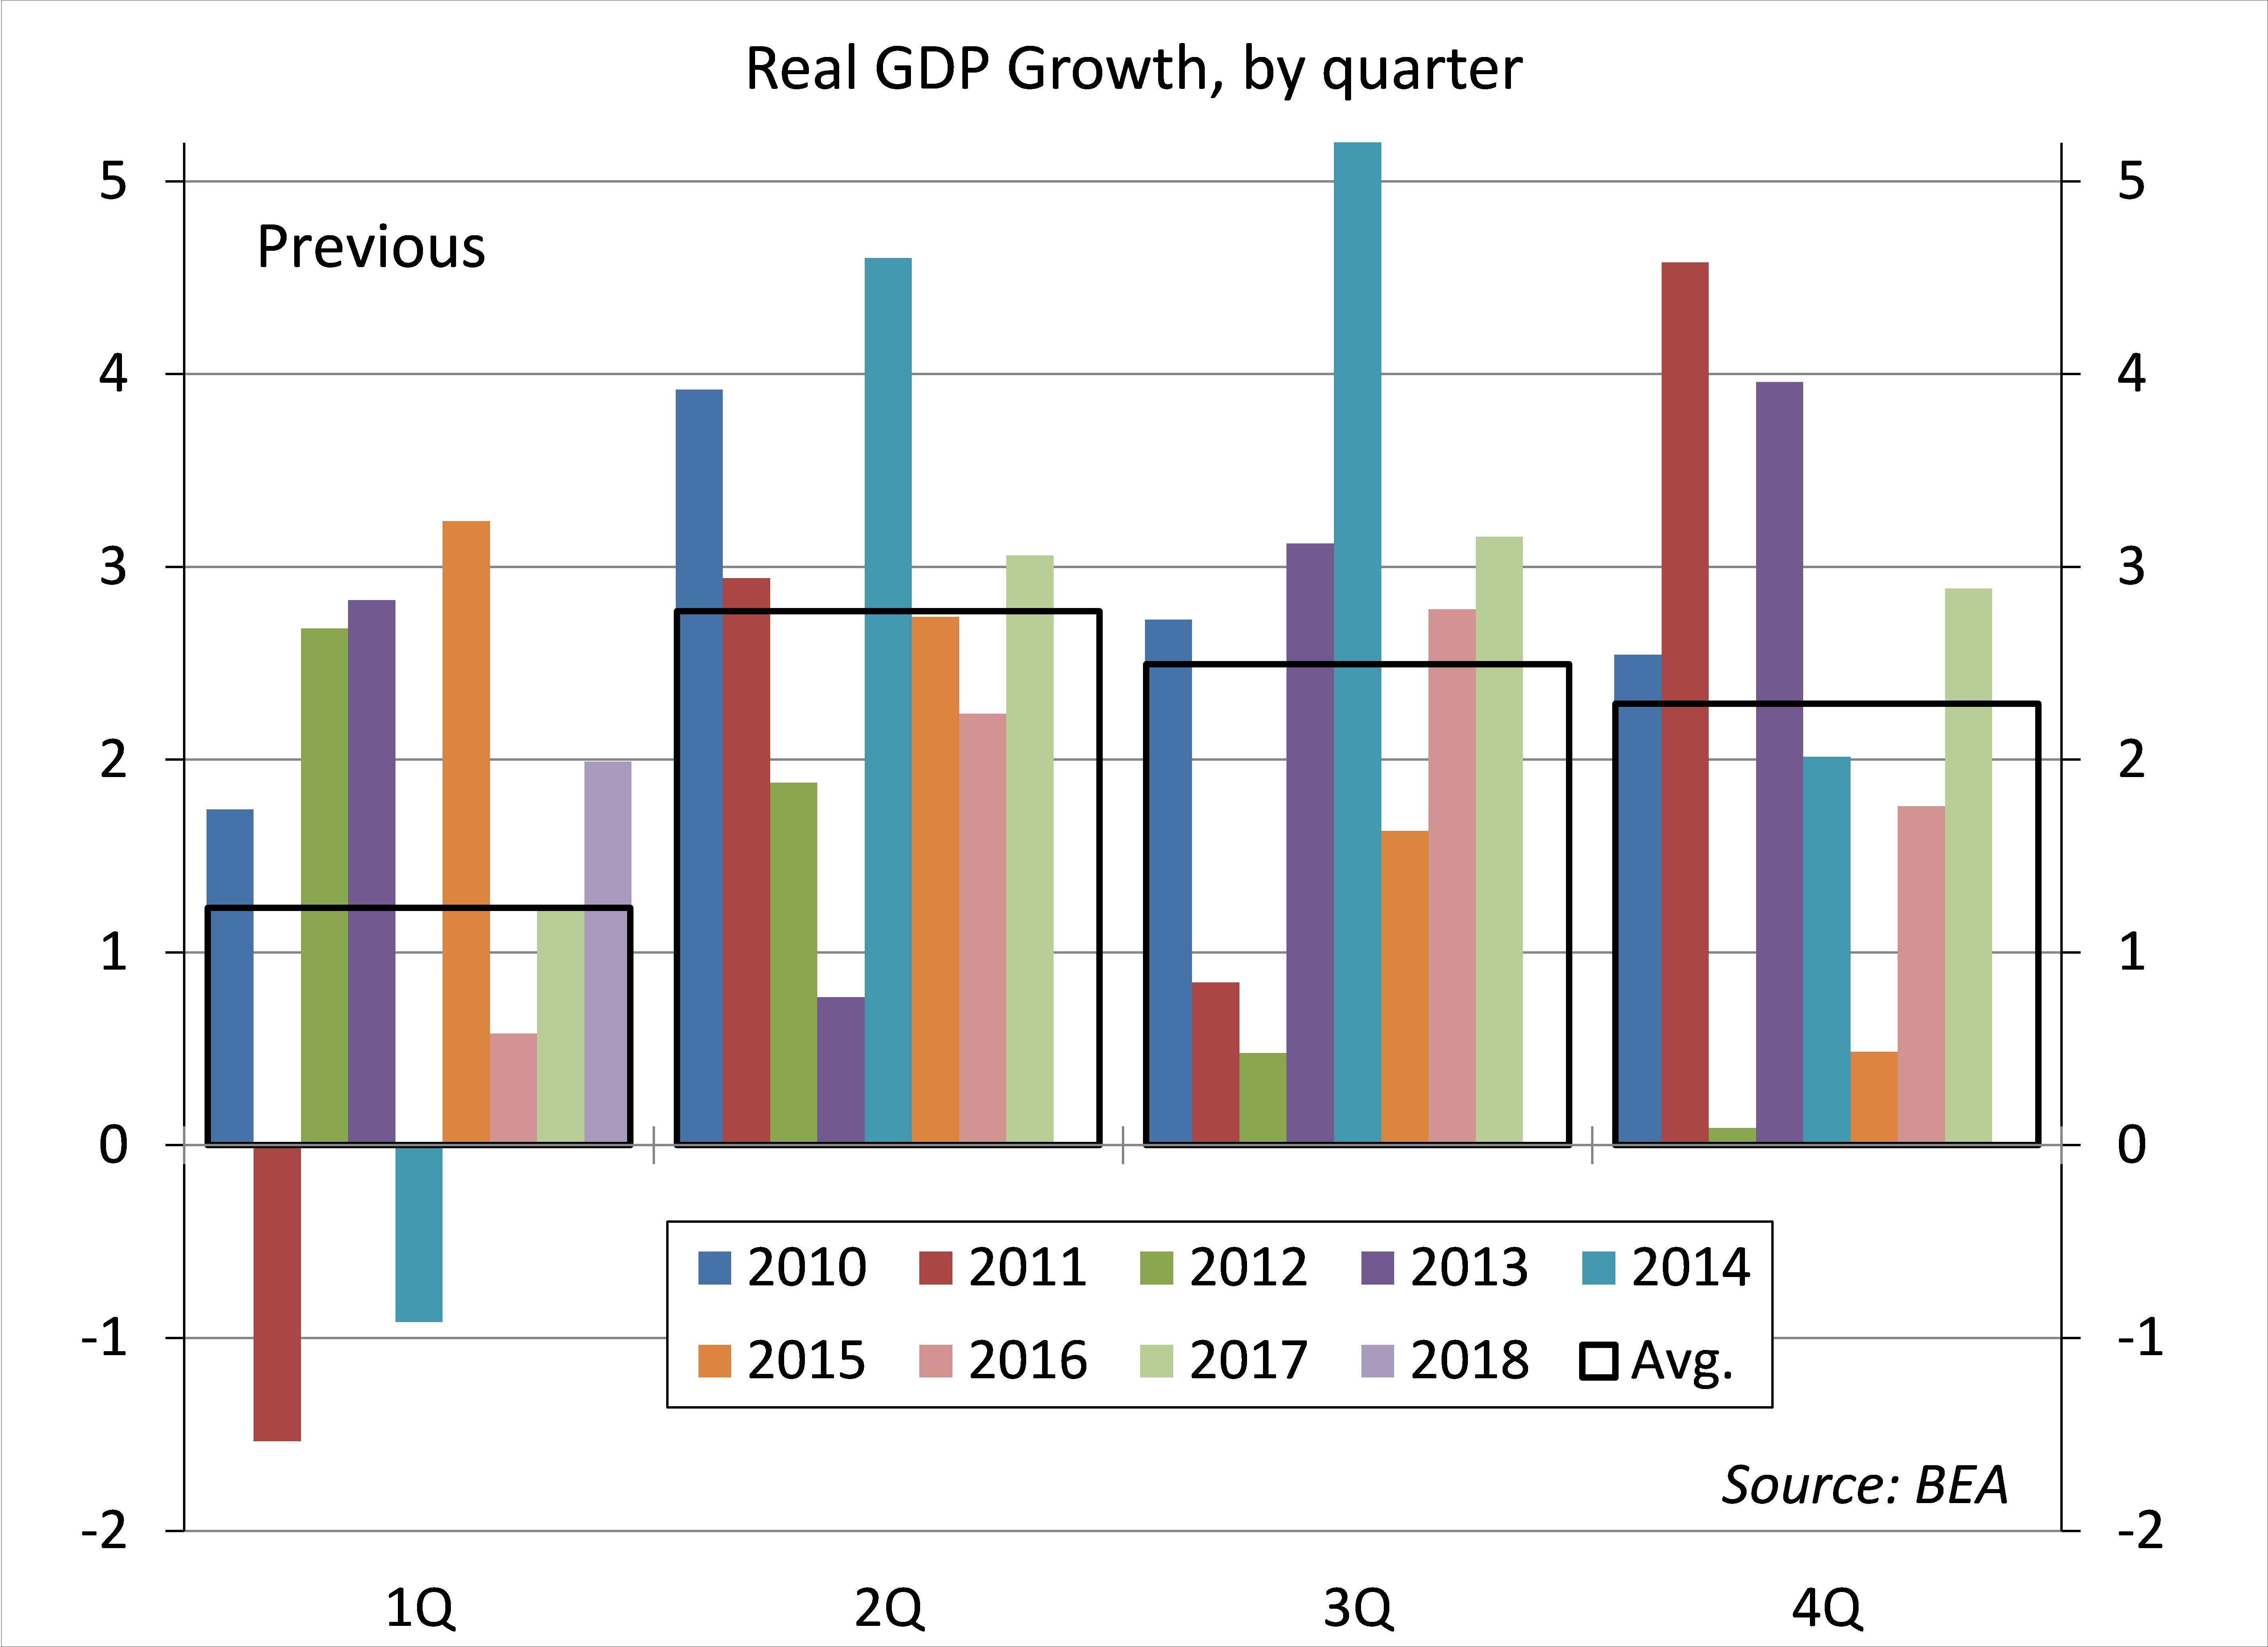
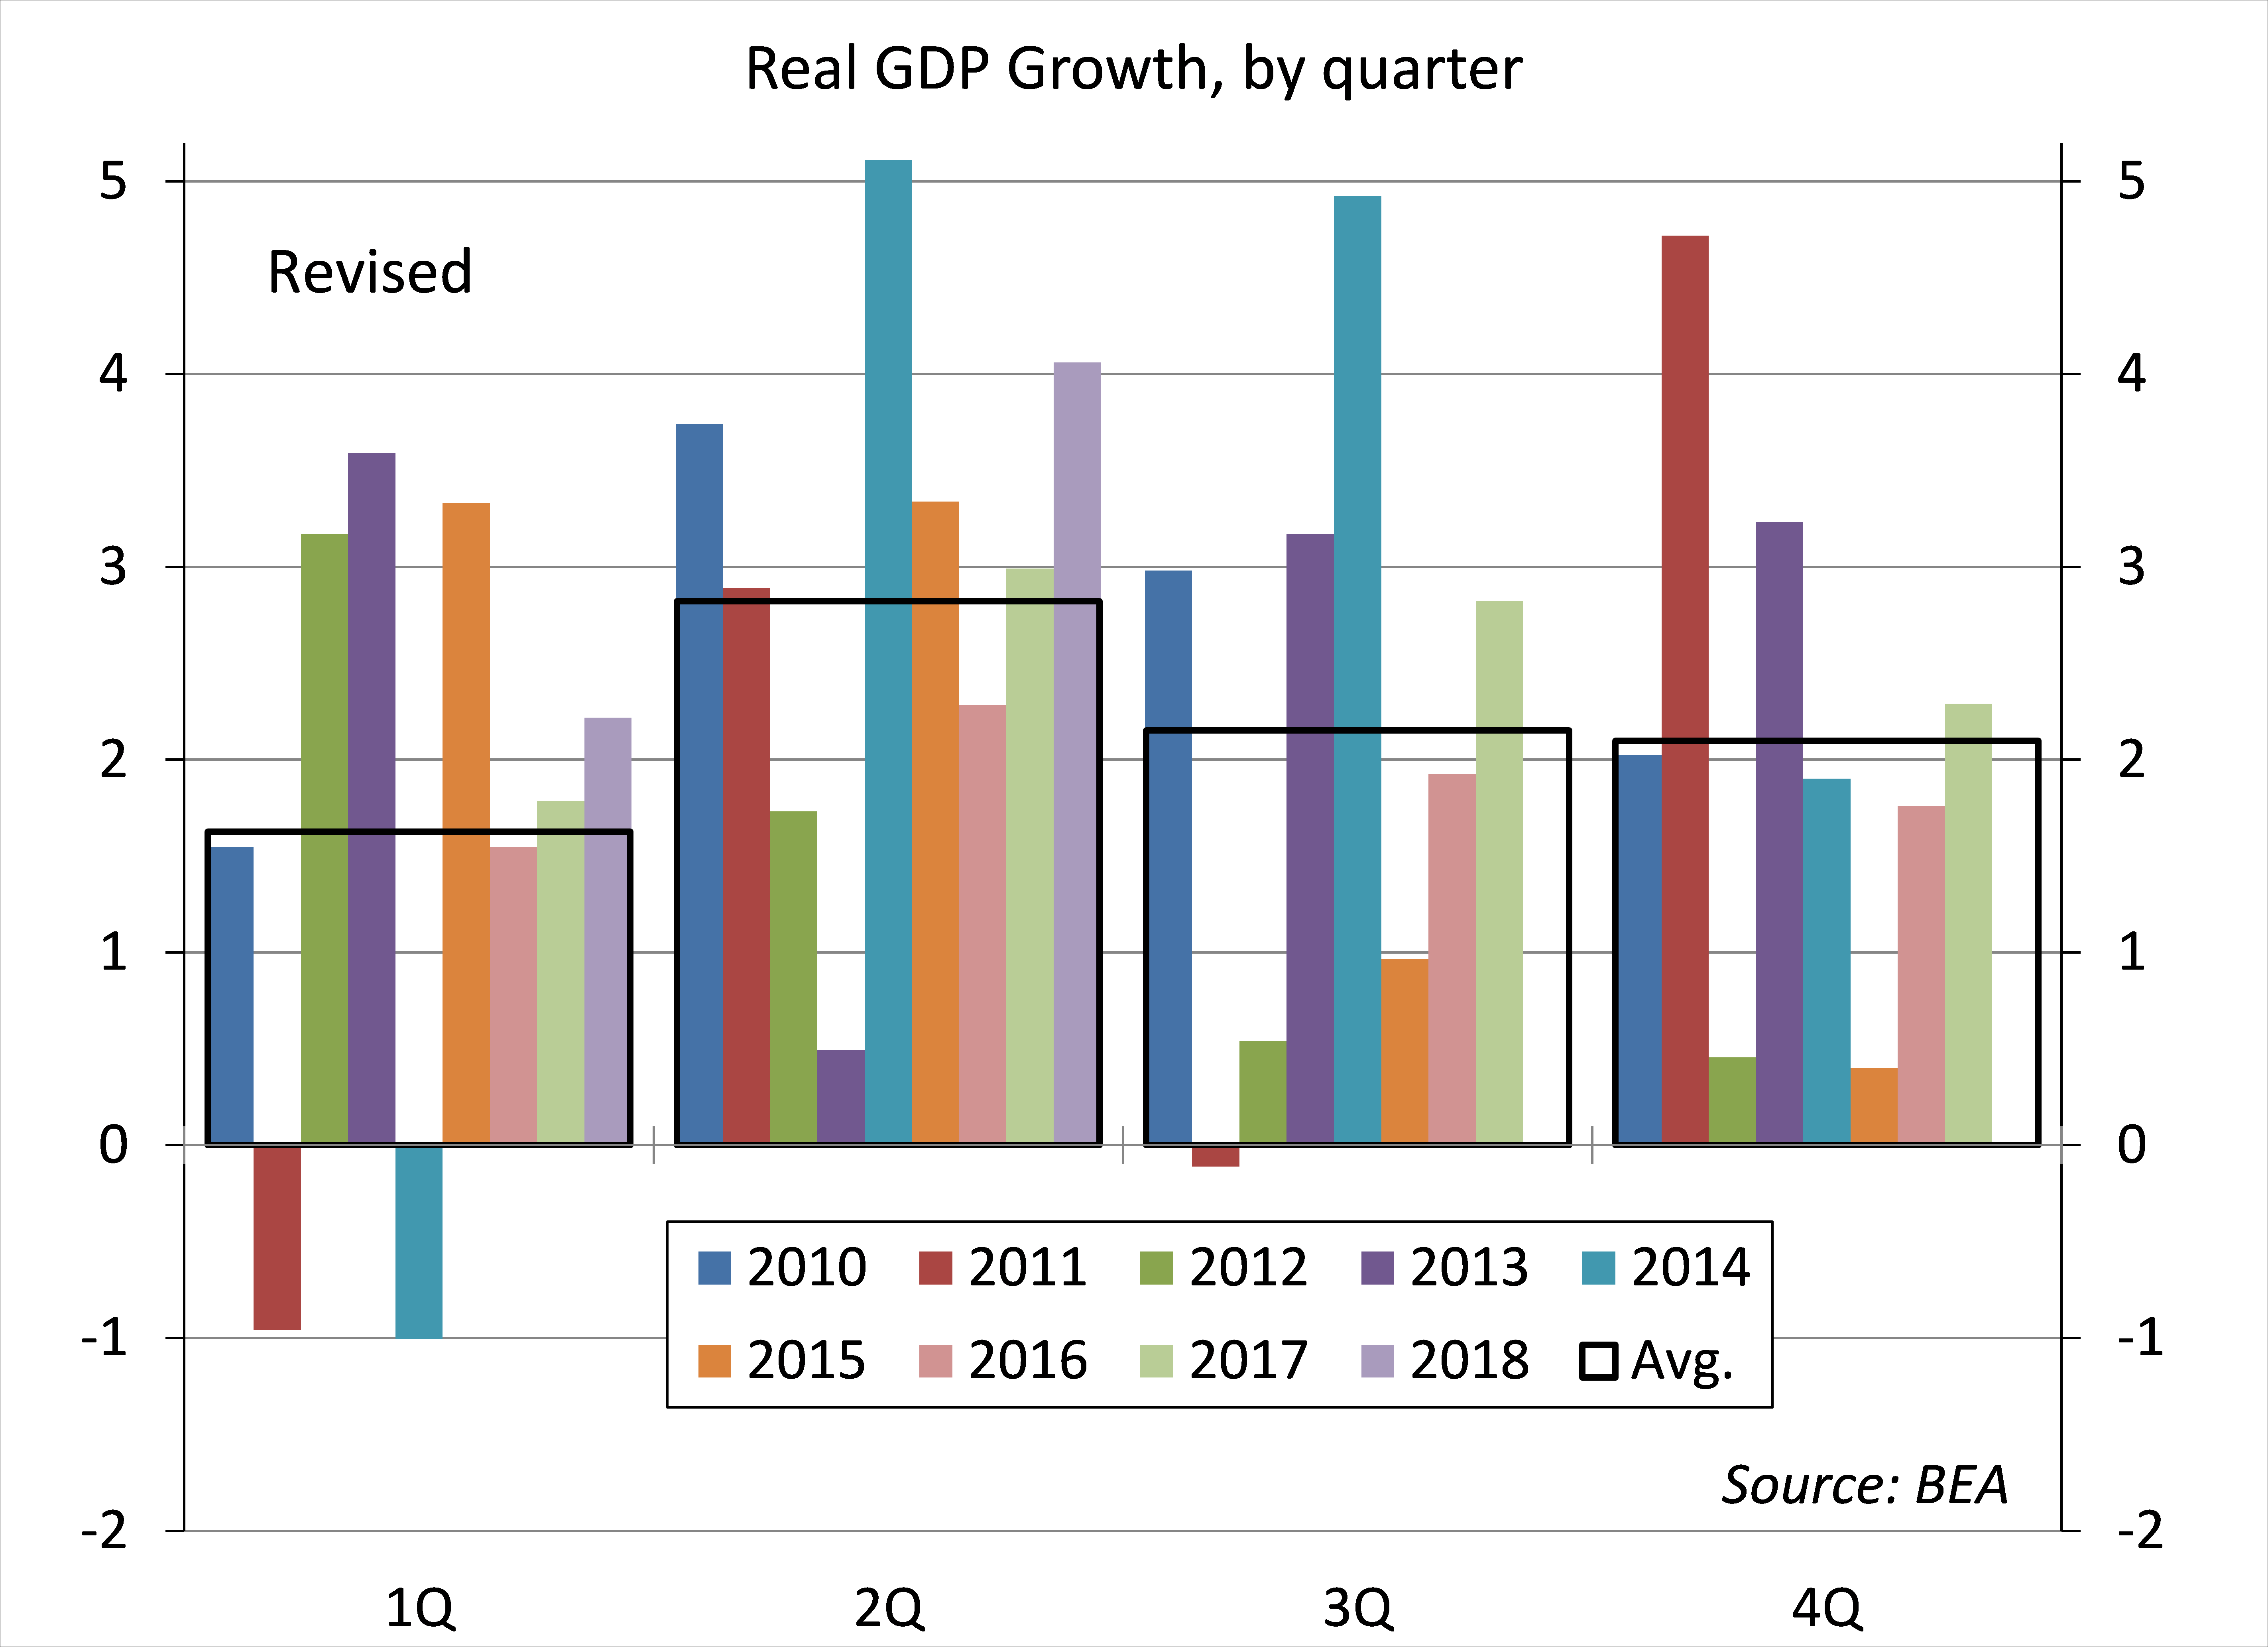
Comprehensive benchmark revisions to the GDP data did not change the recent history much at all. Real GDP rose at a 2.2% annual rate in 2017, slightly lower than the previous estimate. Growth in 2016 was revised slightly higher, to 1.6%. However, focusing on the headline figure hides the offsetting revisions to the GDP components. The residual seasonality (the tendency for subpar first quarter figures) remains in the GDP figures (but is less apparent in consumer spending).
Chart 7
Chart 8
The Federal Open Market Committee will meet to set monetary policy this week, although it’s almost certain that short-term interest rates will remain unchanged. Still, most Fed officials will take the second quarter GDP data as consistent with the view that the pace of growth remains beyond its long-term potential. That can be okay in the short run, as available slack in the labor market is reduced, but eventually you’ll run out of slack. There are some strong arguments for letting the economy run. A tight labor market should lead to higher wage growth and a reallocation of labor to its greater use. However, there is a danger that the economy will overheat, leading to a higher trend in inflation. The June 13 policy statement made it clear that Fed officials still see the stance of monetary policy as “accommodative” – that is, not “neutral” – and the “normalization” of monetary policy has been a key intermediate goal (so we’re not here yet). Moreover, the June dot plot showed that many Fed officials believe that the federal funds target rate will probably need to be set above a neutral rate in 2019 or 2020 to get the economy back to a sustainable path. Soft landings are difficult to achieve. There will be plenty of data between now and the September 25-26 FOMC meeting.
Data Recap – The advance estimate of 2Q18 GDP growth matched expectations and comprehensive benchmark revisions were unexpectedly minor. President Trump fanned trade tensions, only to declare a ceasefire (with the EU) the next day. The stock market reacted to earnings results and continued to ignore the economic data, although trade issues had some impact.
Unintentionally dissing Muhammad Ali, President Trump tweeted that “tariffs are the greatest.” That was a day before meeting with Jean-Claude Juncker, the president of the European Commission. The two agreed to a temporary truce in trade tensions, promising not to raise tariffs on each other while negotiations continue. That was a smart move, as the November election approaches and the fallout of tariffs is making front page news.
Real GDP rose at a 4.1% annual rate in the advance estimate for 2Q18, vs. +2.2% in 1Q18 (revised from +2.0%).
Durable Goods Orders rose 1.0% in the initial estimate for June, reflecting a smaller-than-expected pickup in civilian aircraft orders (Boeing reported a huge increase, which may show up in the data for July). Ex-transportation, orders rose 0.4%, but with an upward revision to May. Results were mostly higher across categories. Orders for nondefense capital goods ex-aircraft rose 0.6% (median forecast: +0.4%), with an upward revision to May: a 10.9% annual rate in 2Q18 (vs. +1.5% in 1Q18). Shipments (for this category) rose 1.0%: a 4.6% annual rate in 2Q18 (vs. +2.9% in 1Q18, +11.3% in 4Q17, and +10.3% in 3Q17).
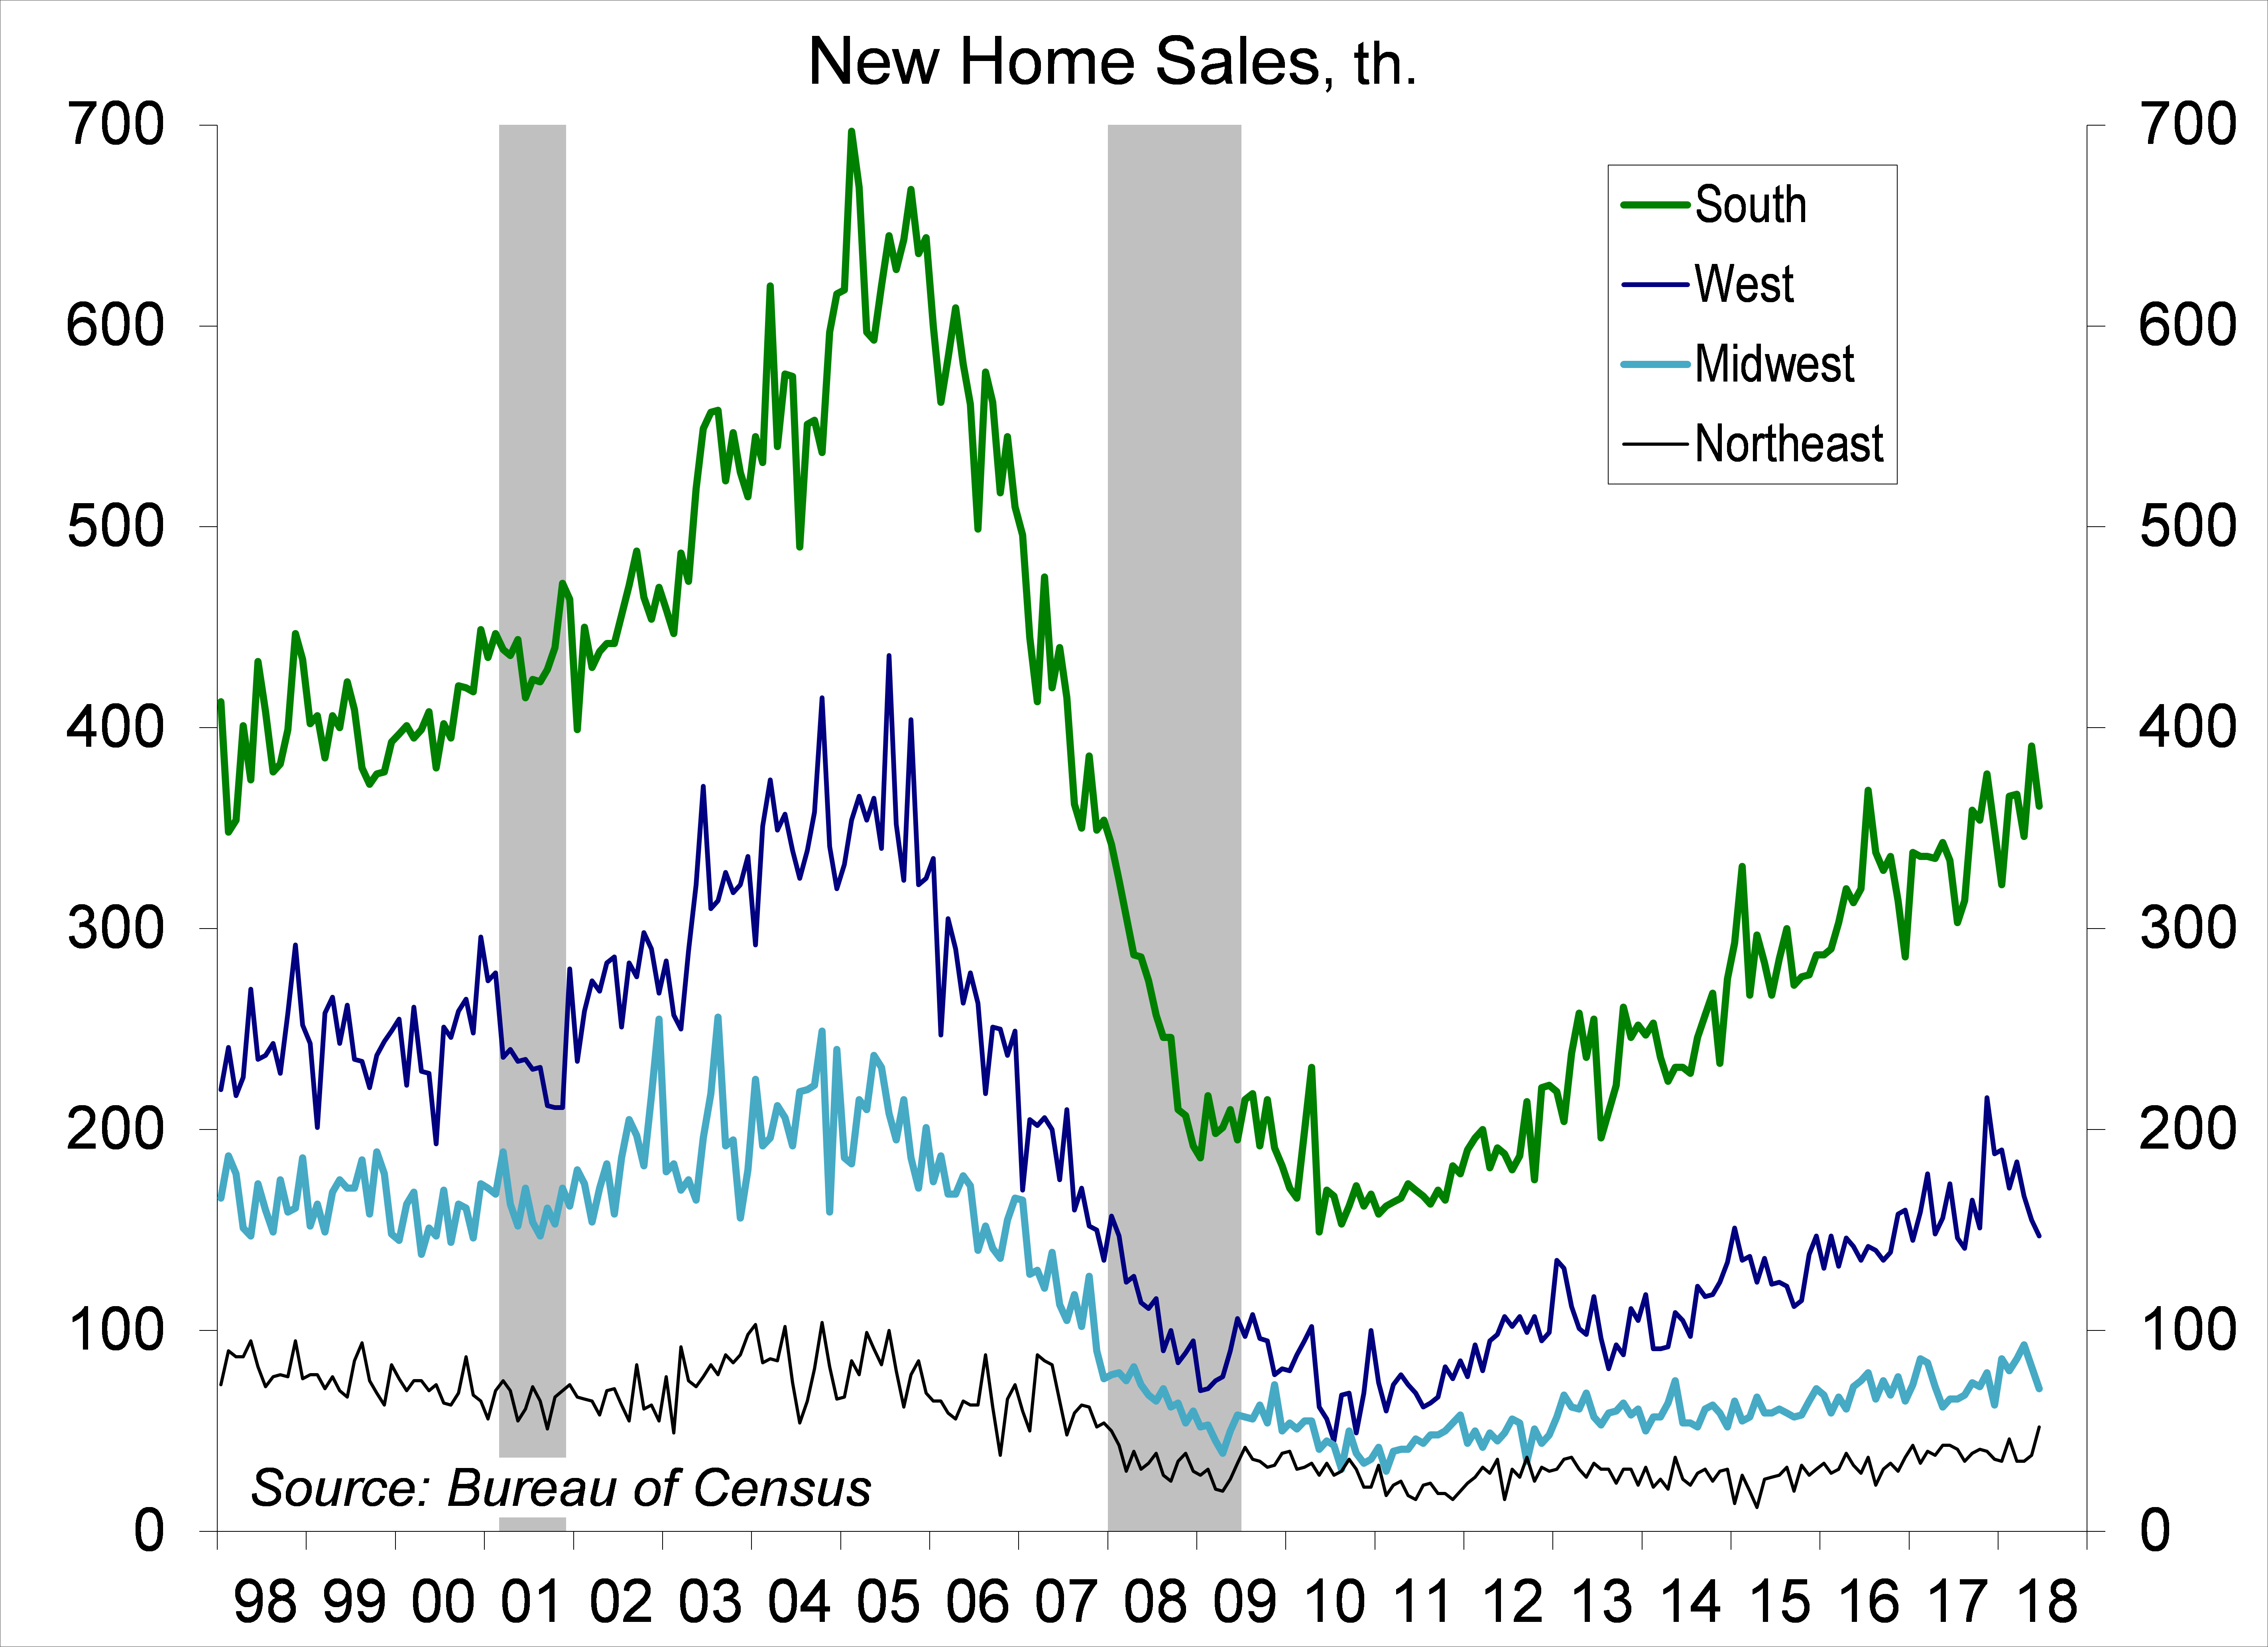
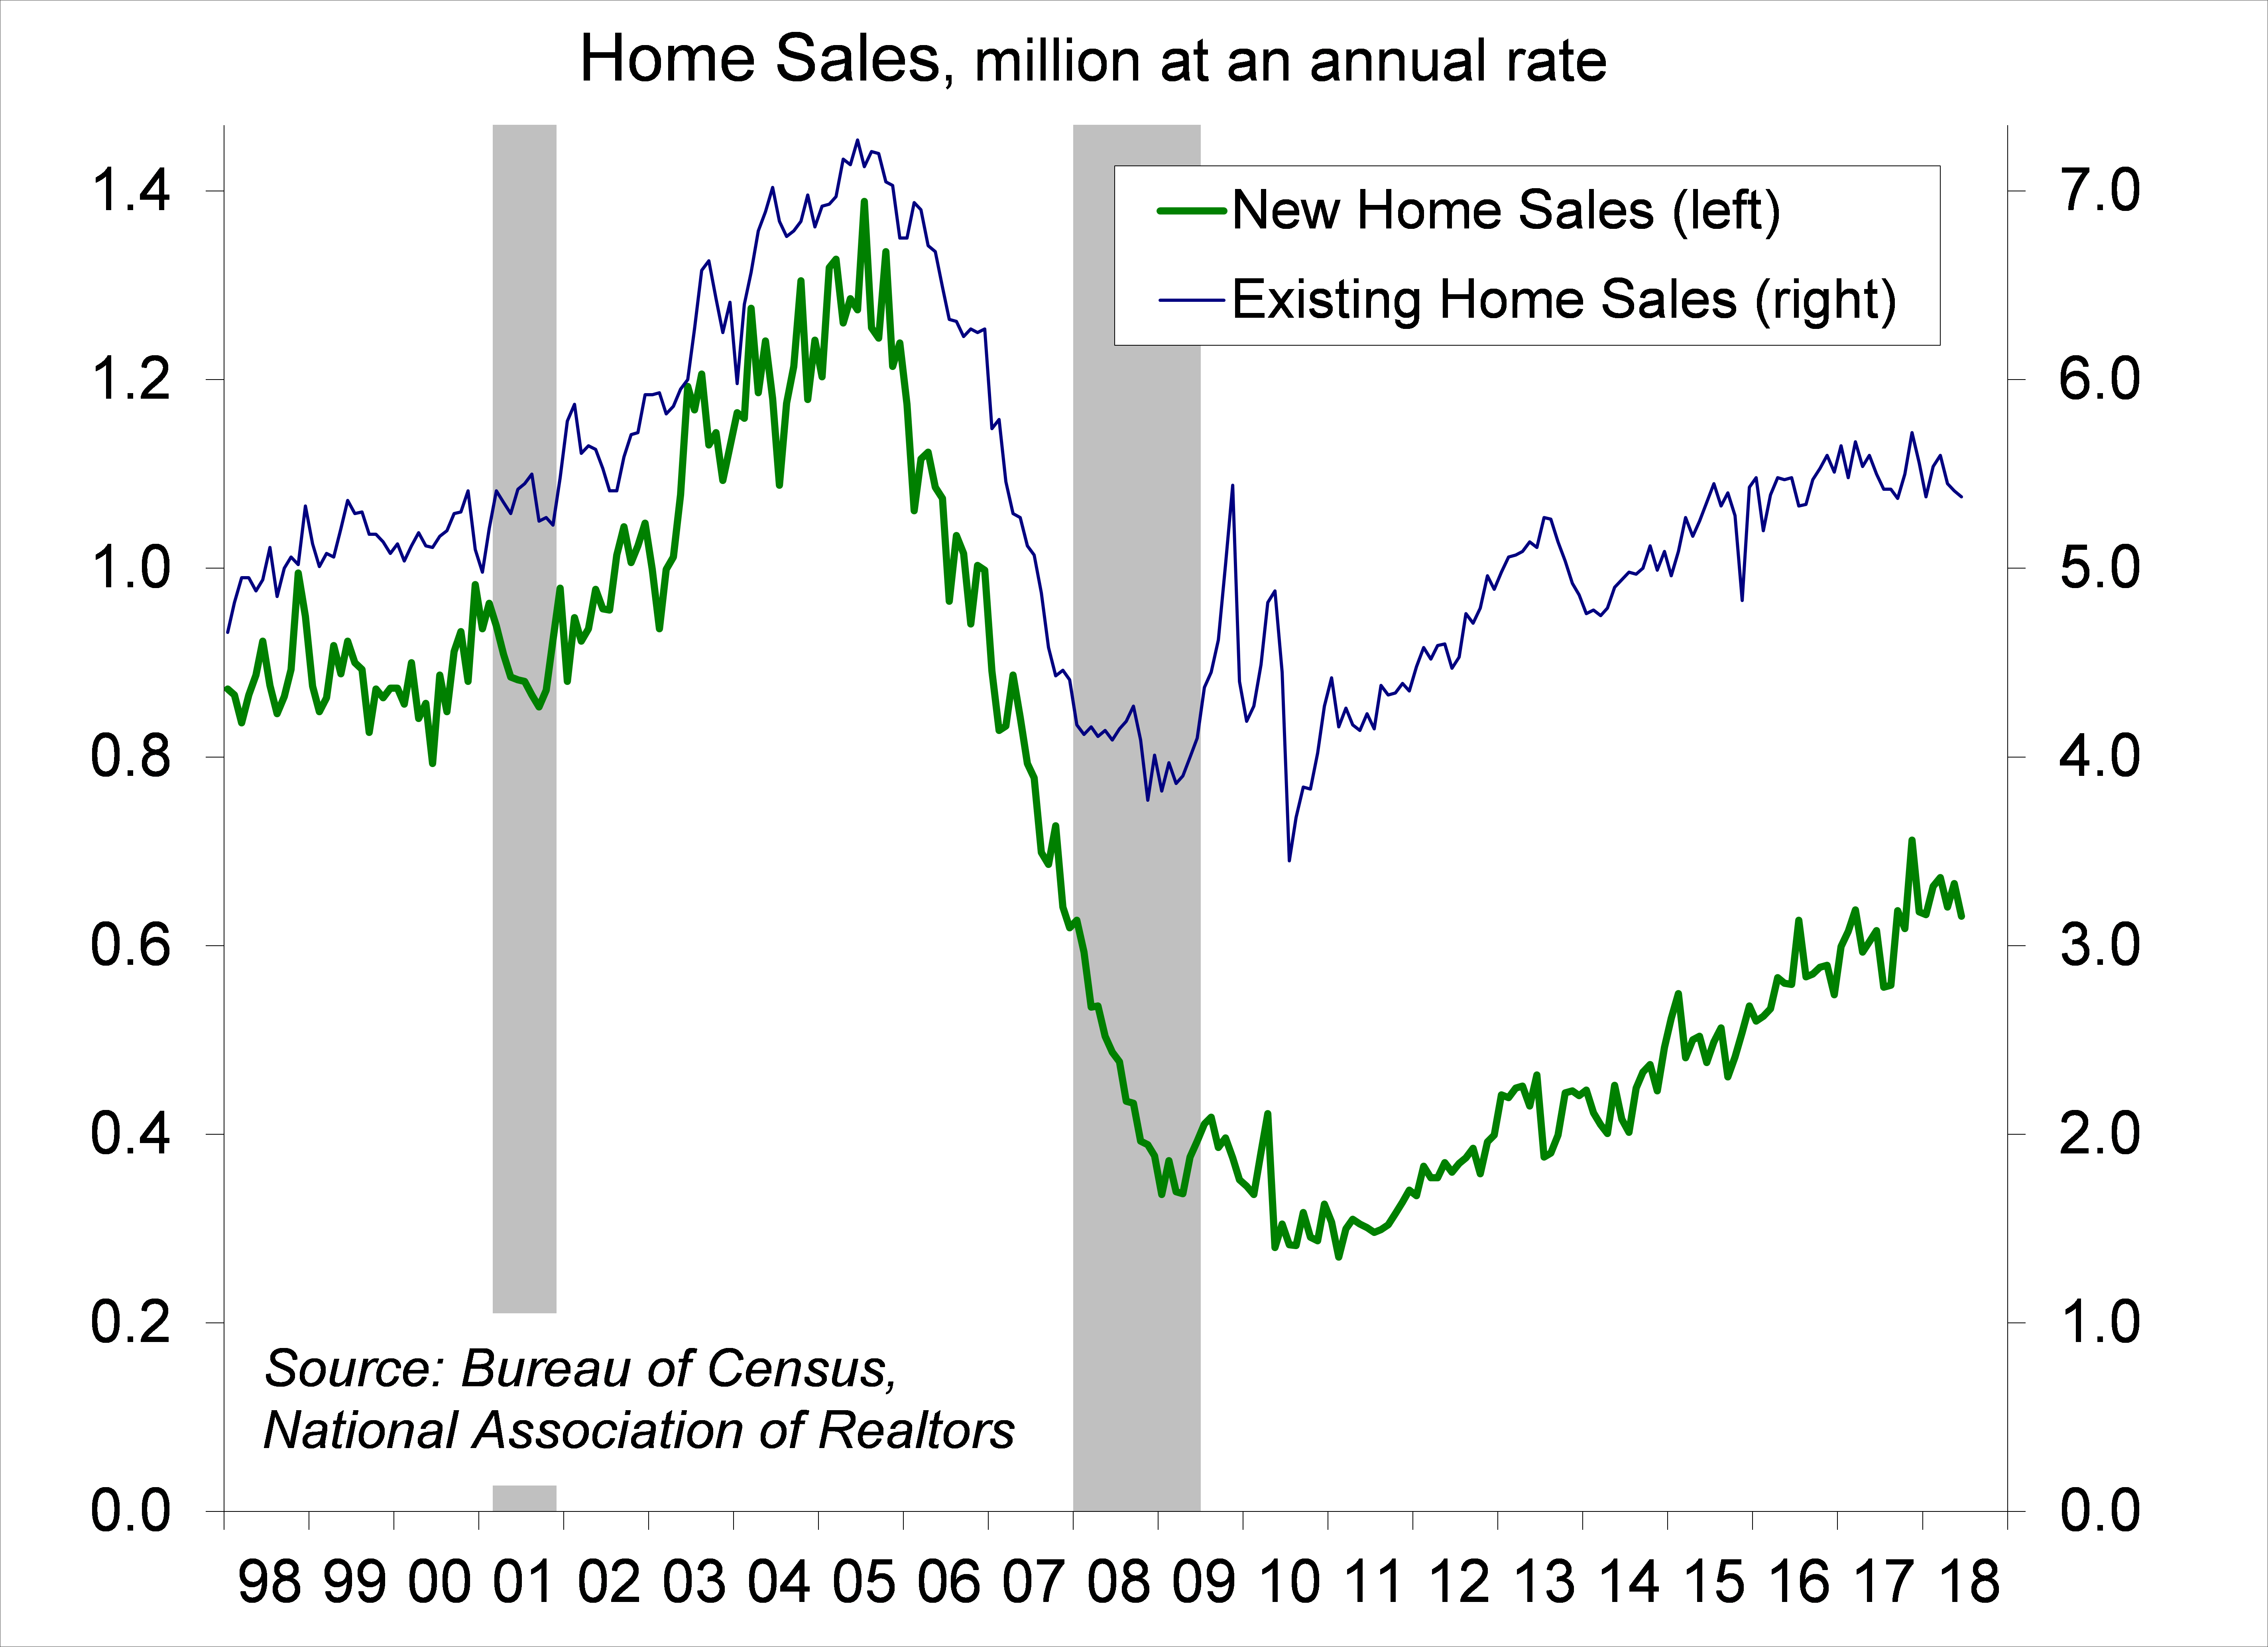
New Home Sales fell 5.3% (±17.1%) to a 631,000 seasonally adjusted annual rate (2.4% ±24.0% y/y).
Chart 9
Chart 10
Existing Home Sales slipped 0.6%, to a 5.38 million seasonally adjusted annual rate in June (-2.2% y/y). Unadjusted sales for the second quarter were down 2.3% y/y (-8.1% Northeast, -2.5% Midwest, +0.5% South, -3.7% West).
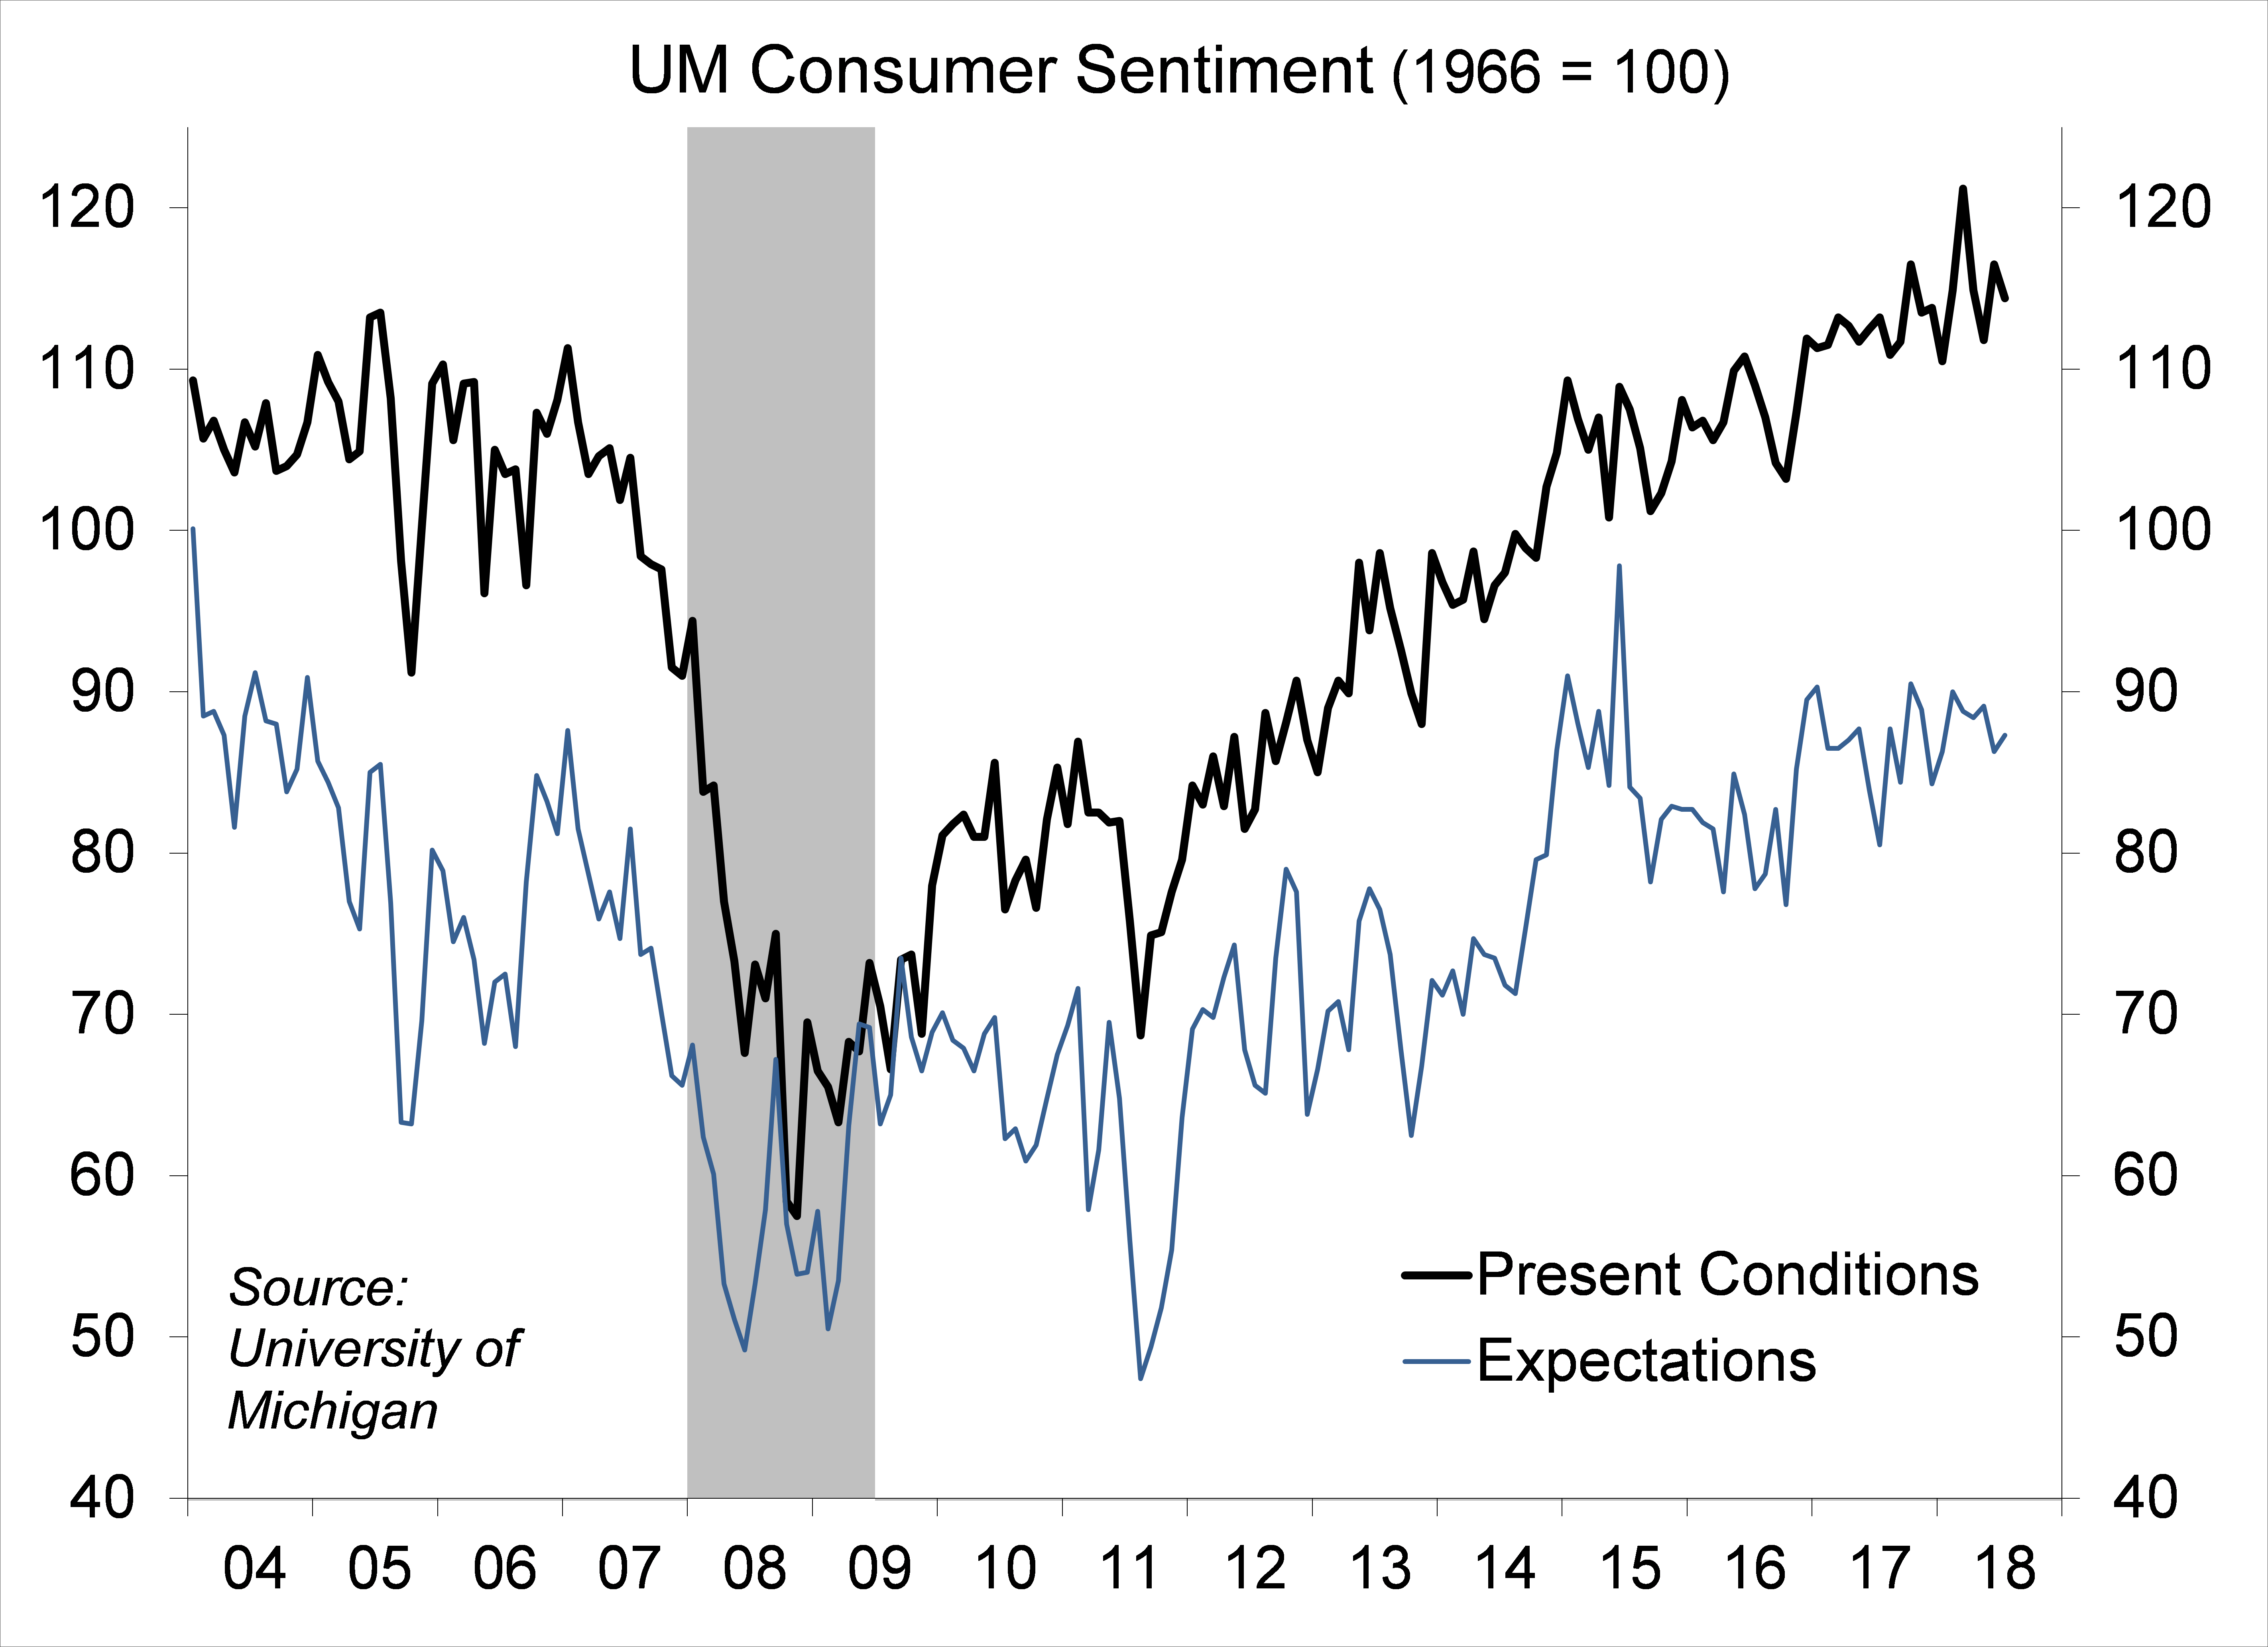
The University of Michigan’s Consumer Sentiment Index was little changed in the full-month estimate for July (97.9, vs. 97.1 at mid-month and 98.2 in June). Consumers are optimistic about jobs and incomes, but are concerned about the impact of tariffs.
Chart 11
Chart 12
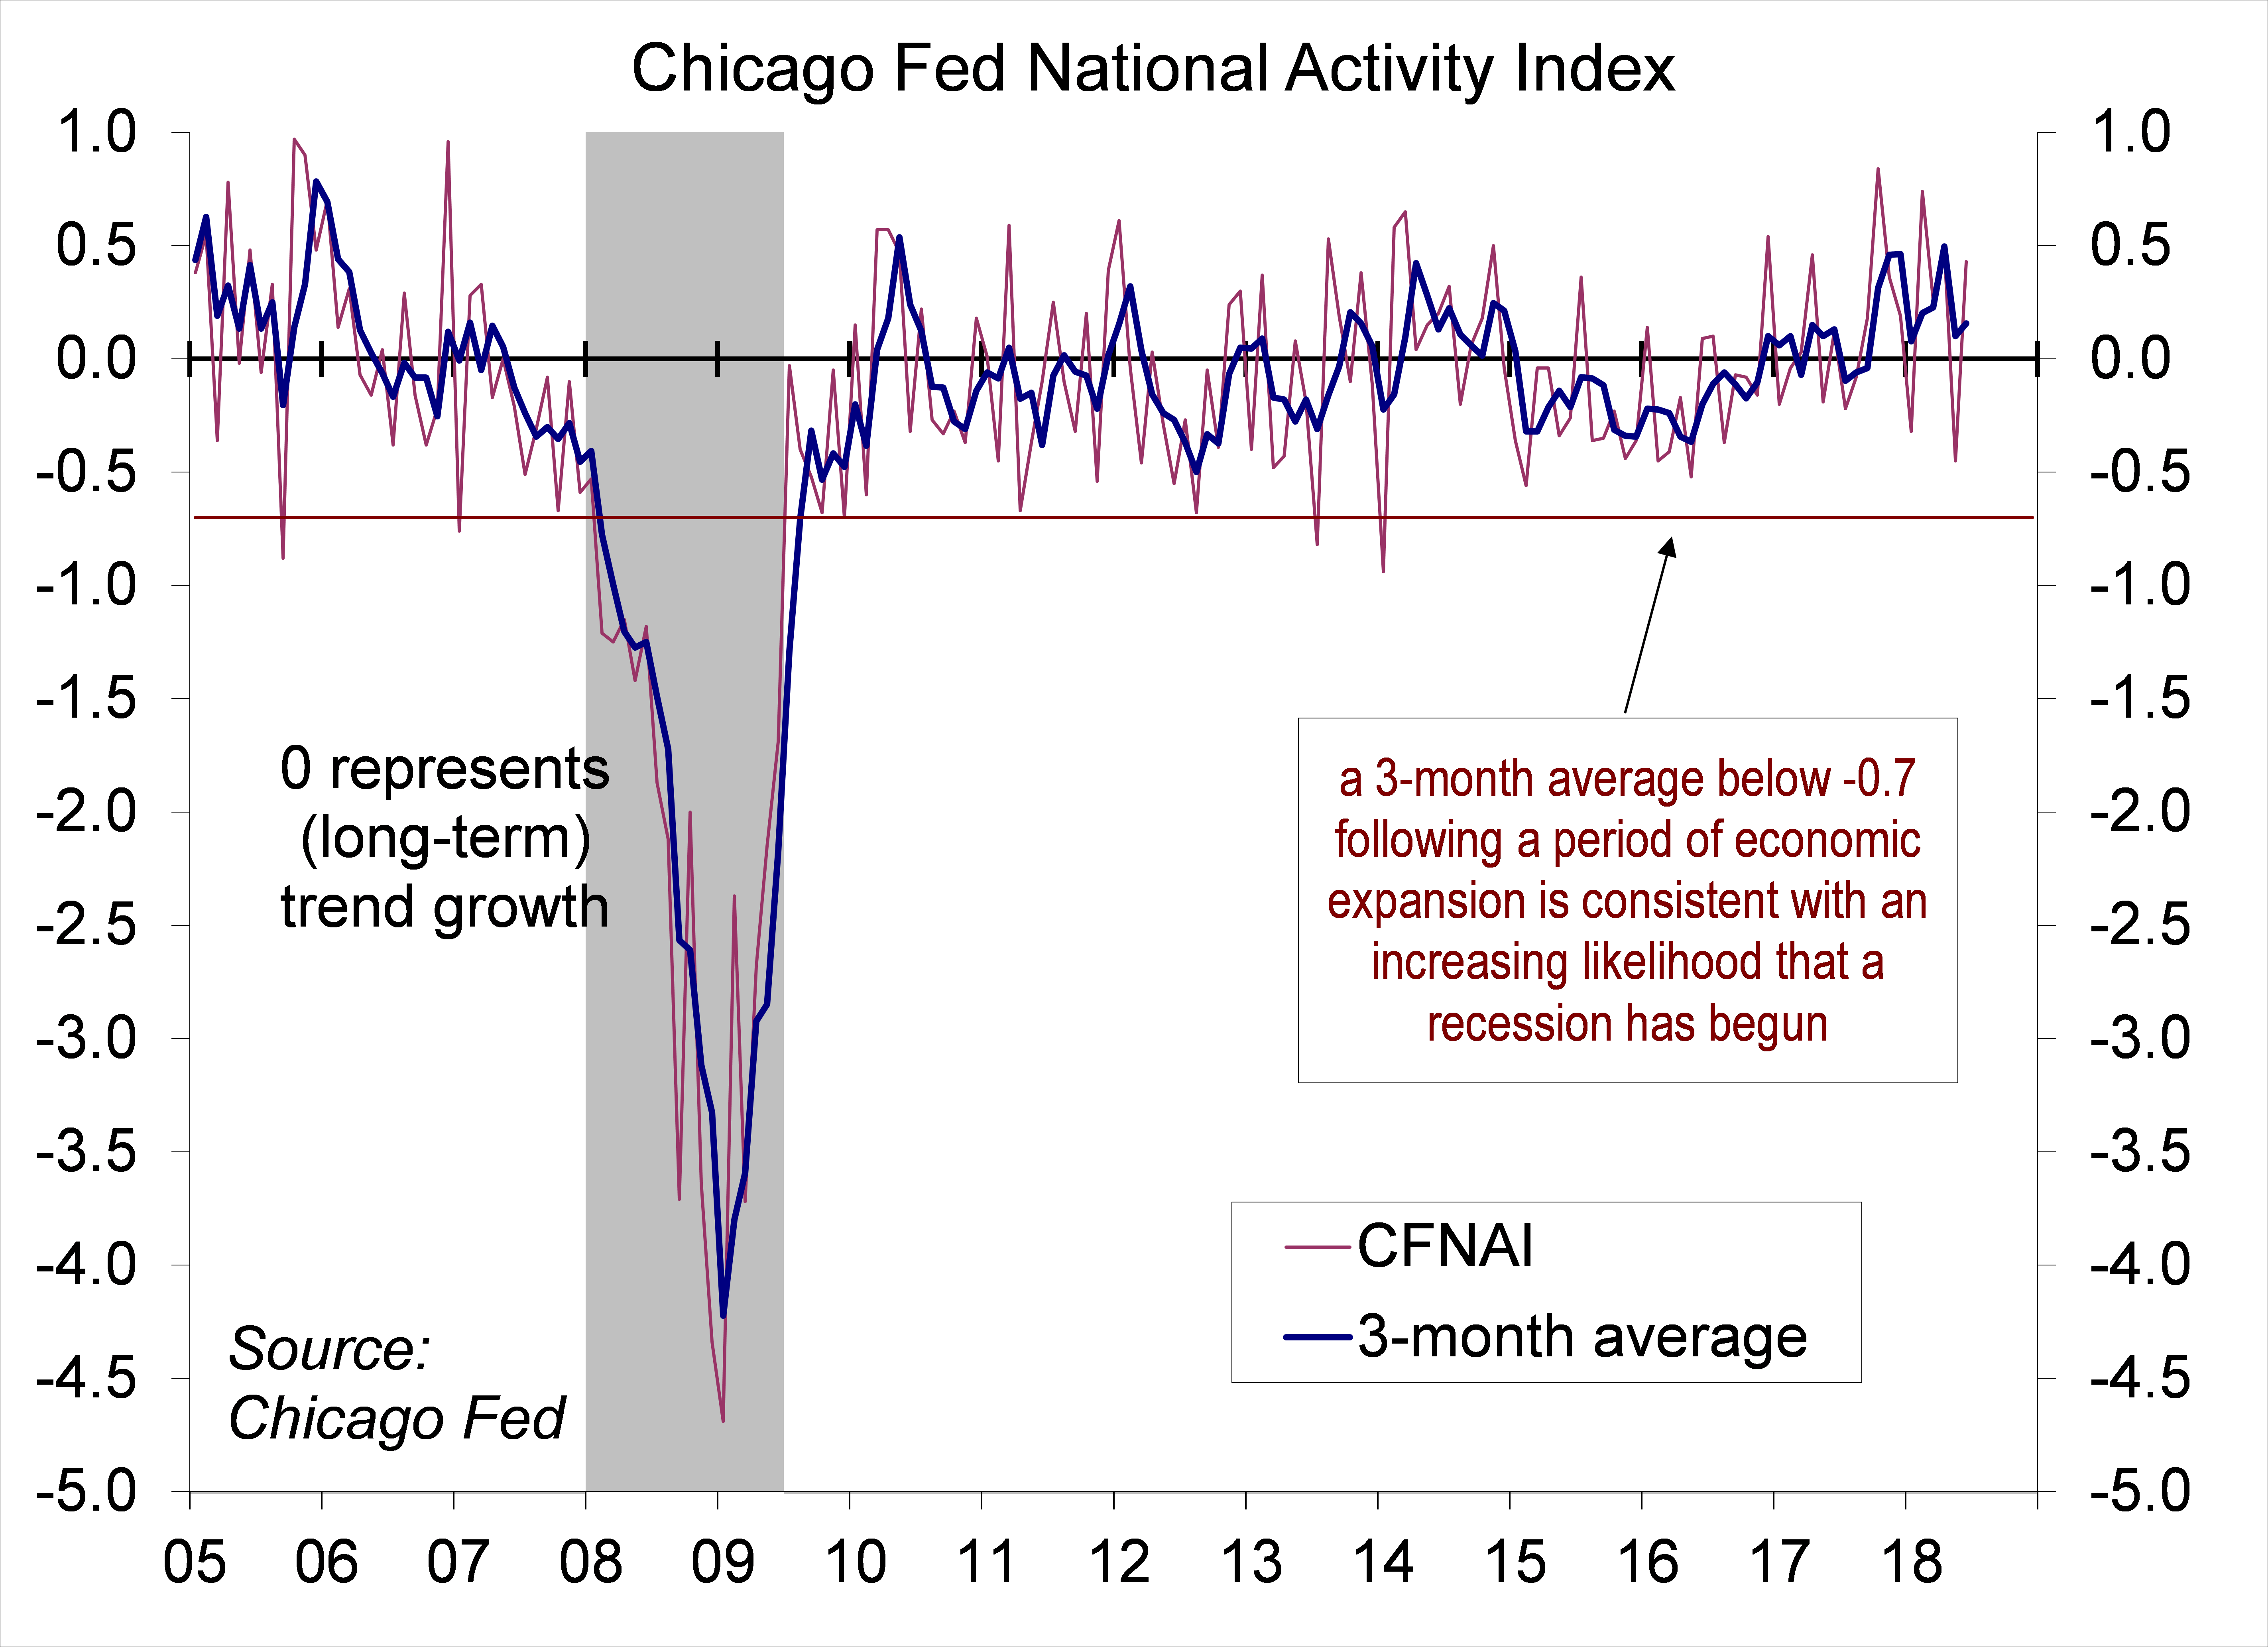
The Chicago Fed National Activity Index, a composite of 85 economic indicators, rebounded to +0.43 in June, vs. -0.45 in May. At +0.16, the three-month average was consistent with above-trend growth in the near term.
The opinions offered by Dr. Brown should be considered a part of your overall decision-making process. For more information about this report – to discuss how this outlook may affect your personal situation and/or to learn how this insight may be incorporated into your investment strategy – please contact your financial advisor or use the convenient Office Locator to find our office(s) nearest you today.
All expressions of opinion reflect the judgment of the Research Department of Raymond James & Associates (RJA) at this date and are subject to change. Information has been obtained from sources considered reliable, but we do not guarantee that the foregoing report is accurate or complete. Other departments of RJA may have information which is not available to the Research Department about companies mentioned in this report. RJA or its affiliates may execute transactions in the securities mentioned in this report which may not be consistent with the report’s conclusions. RJA may perform investment banking or other services for, or solicit investment banking business from, any company mentioned in this report. For institutional clients of the European Economic Area (EEA): This document (and any attachments or exhibits hereto) is intended only for EEA Institutional Clients or others to whom it may lawfully be submitted. There is no assurance that any of the trends mentioned will continue in the future. Past performance is not indicative of future results.


