The Week That Was – July 23 2018
Recent economic data reports, while mixed, continued to paint a picture of a strengthening economy in 2Q18. This improvement, expected to be seen in the GDP report to be released this Friday, partly reflects a rebound from a “soft” 1Q18. Averaging the two quarters should show a robust pace of growth in the first half of the year. Comprehensive benchmark revisions are likely to shift the recent numbers around to some extent, as the Bureau of Economic Analysis will address the issue of residual seasonality (the tendency for the first quarter GDP growth figures to be lower than the average pace for the rest of the year). Still, there’s a growing cloud on the horizon. Trade policy is cited as an increasing concern, the risks of a broader trade war are growing, and the uncertainty is having a negative impact on capital spending decisions here and abroad.
First the good news. Retail sales rose about as expected in the initial estimate for June, but May figures were revised higher, pointing to a pickup in consumer spending growth in 2Q18, probably close to a 3.0% annual rate. Inflation-adjusted spending rose at a 0.9% annual rate in 1Q18, so a second quarter pickup was widely anticipated. Still, that would average to a little under a 2% pace in the first half. Job growth remains supportive. Nominal wage growth is gradually rising (2.7% for the 12 months ending in June), but gains have been offset by higher inflation (2.9%). That reflects higher gasoline prices, which will have a mixed impact (depending on how much one drives). Core inflation is around 2%, so real wages should pick up as gasoline prices stabilize.
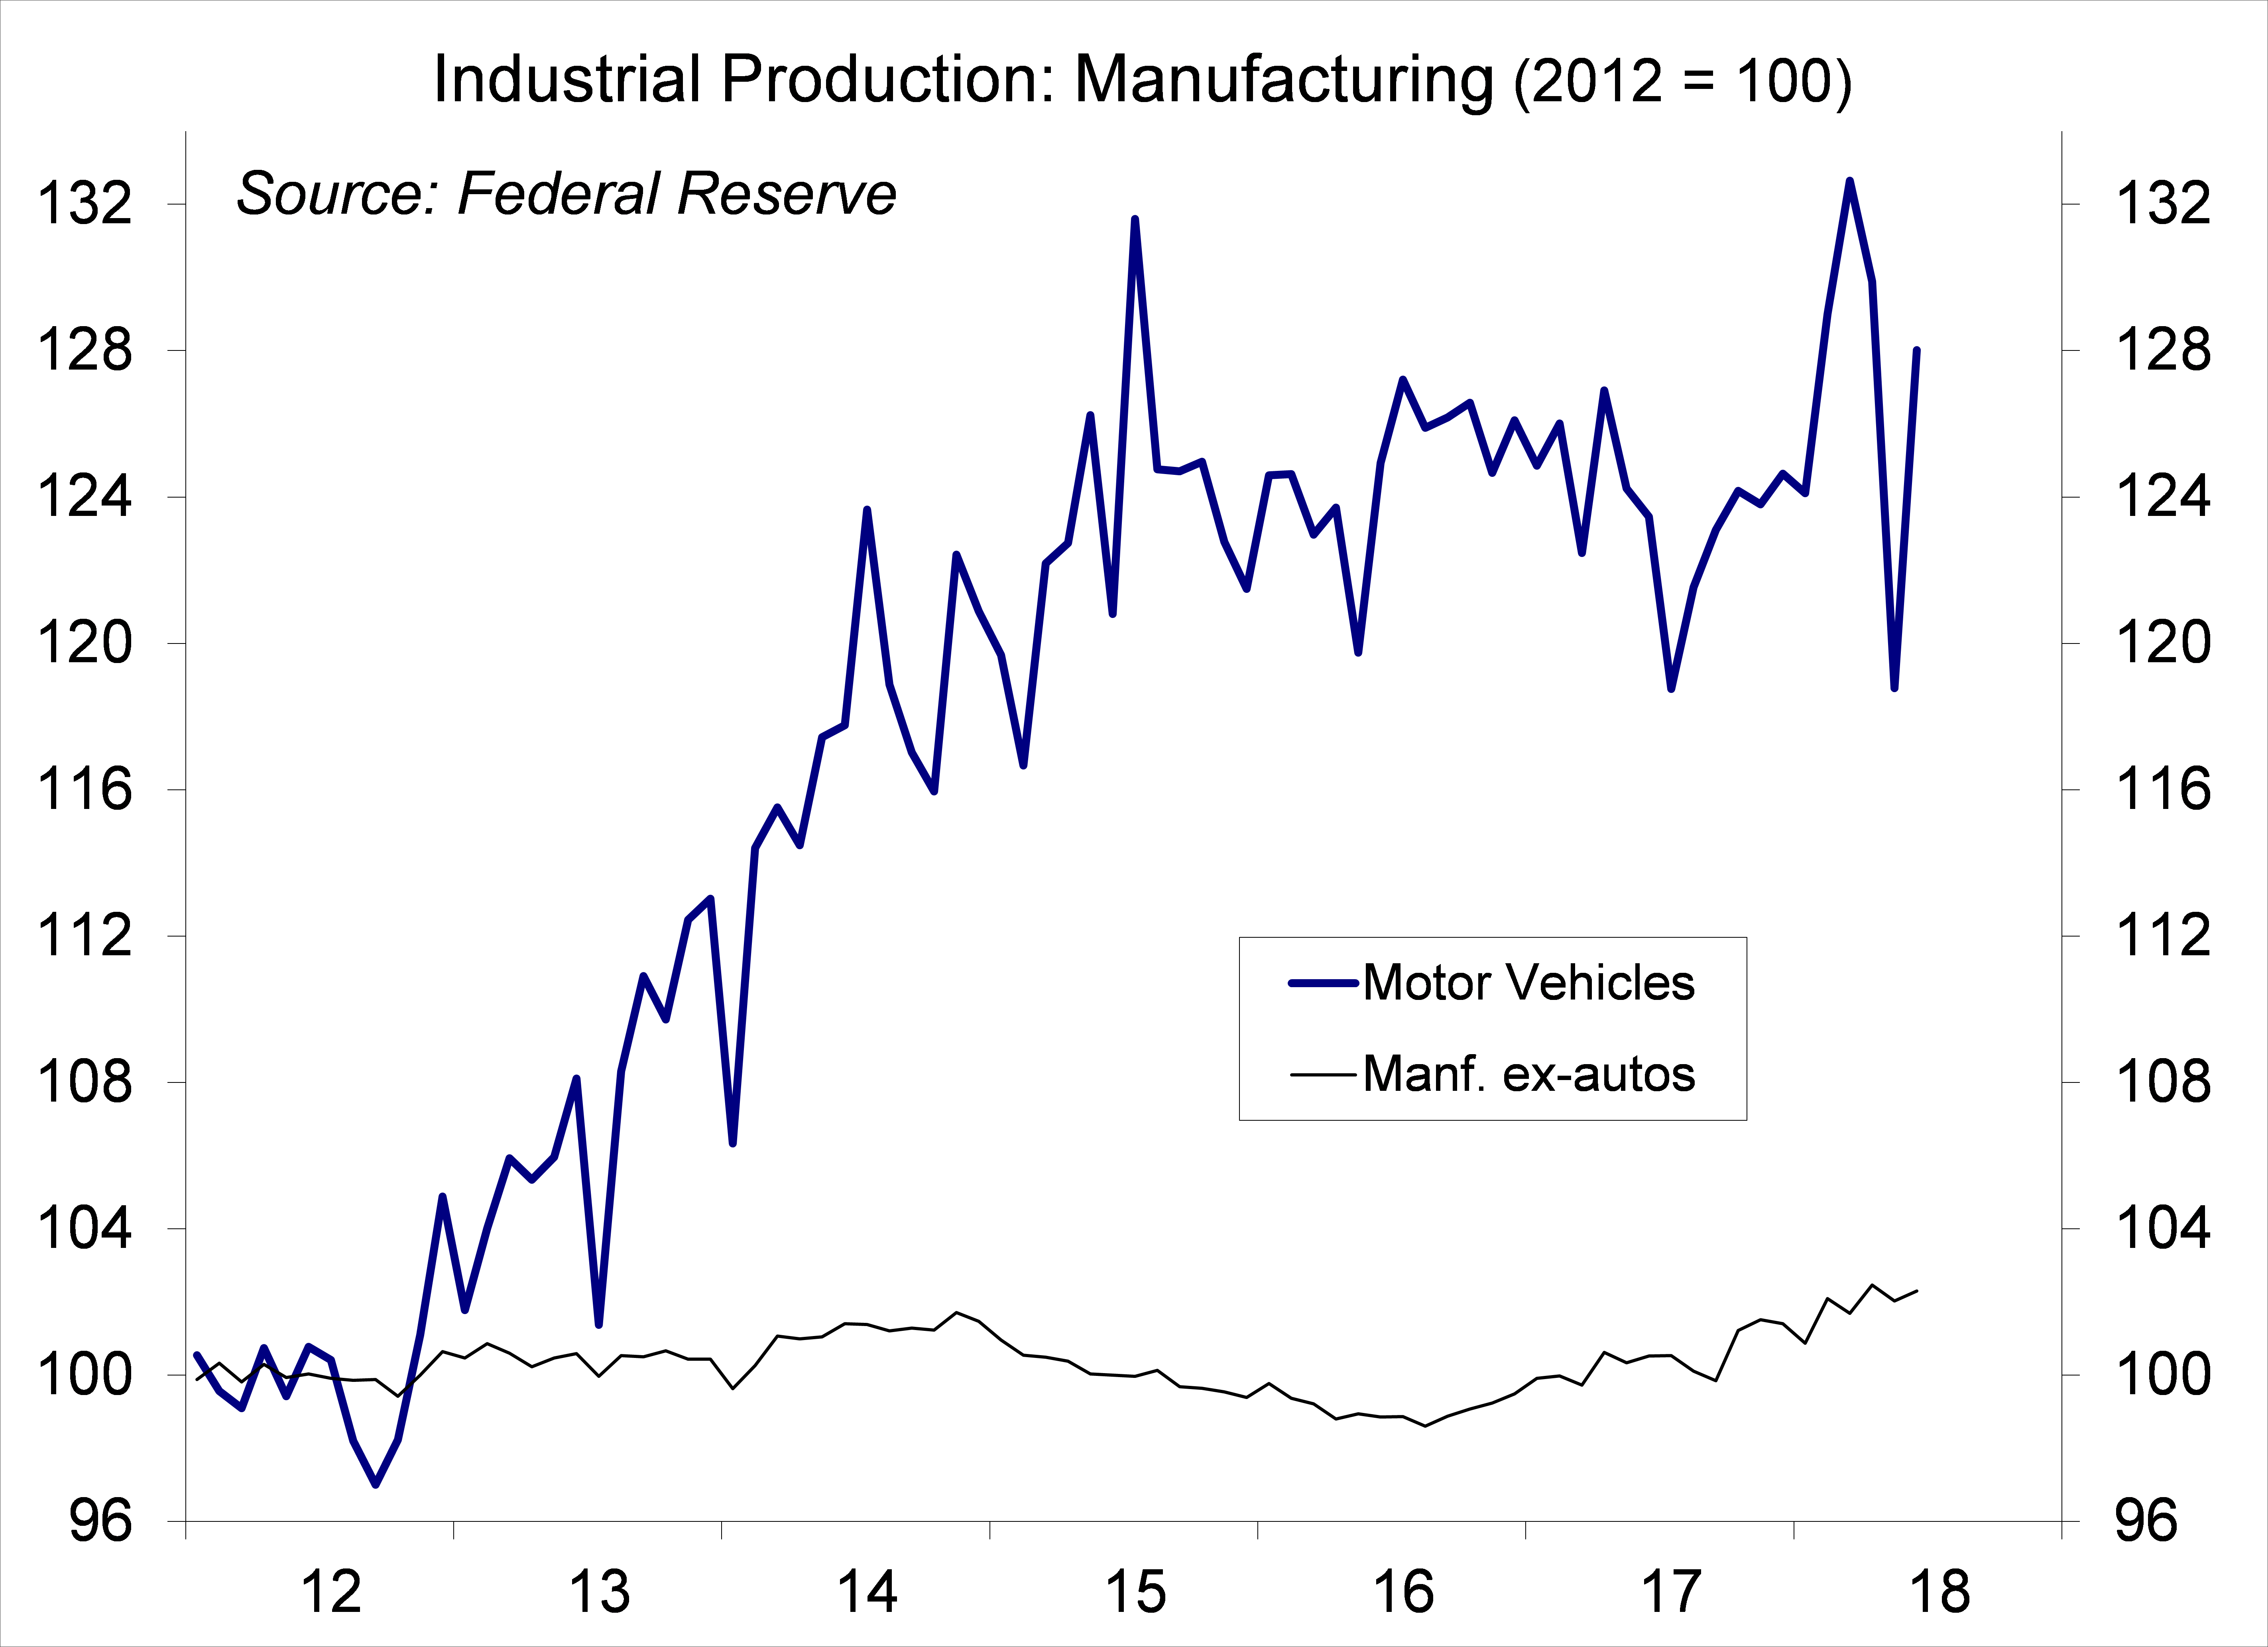
The Federal Reserve’s measure of industrial production is rising, but manufacturing output growth has been mixed and generally unimpressive, averaging a 1.9% annual rate in the first half of the year.
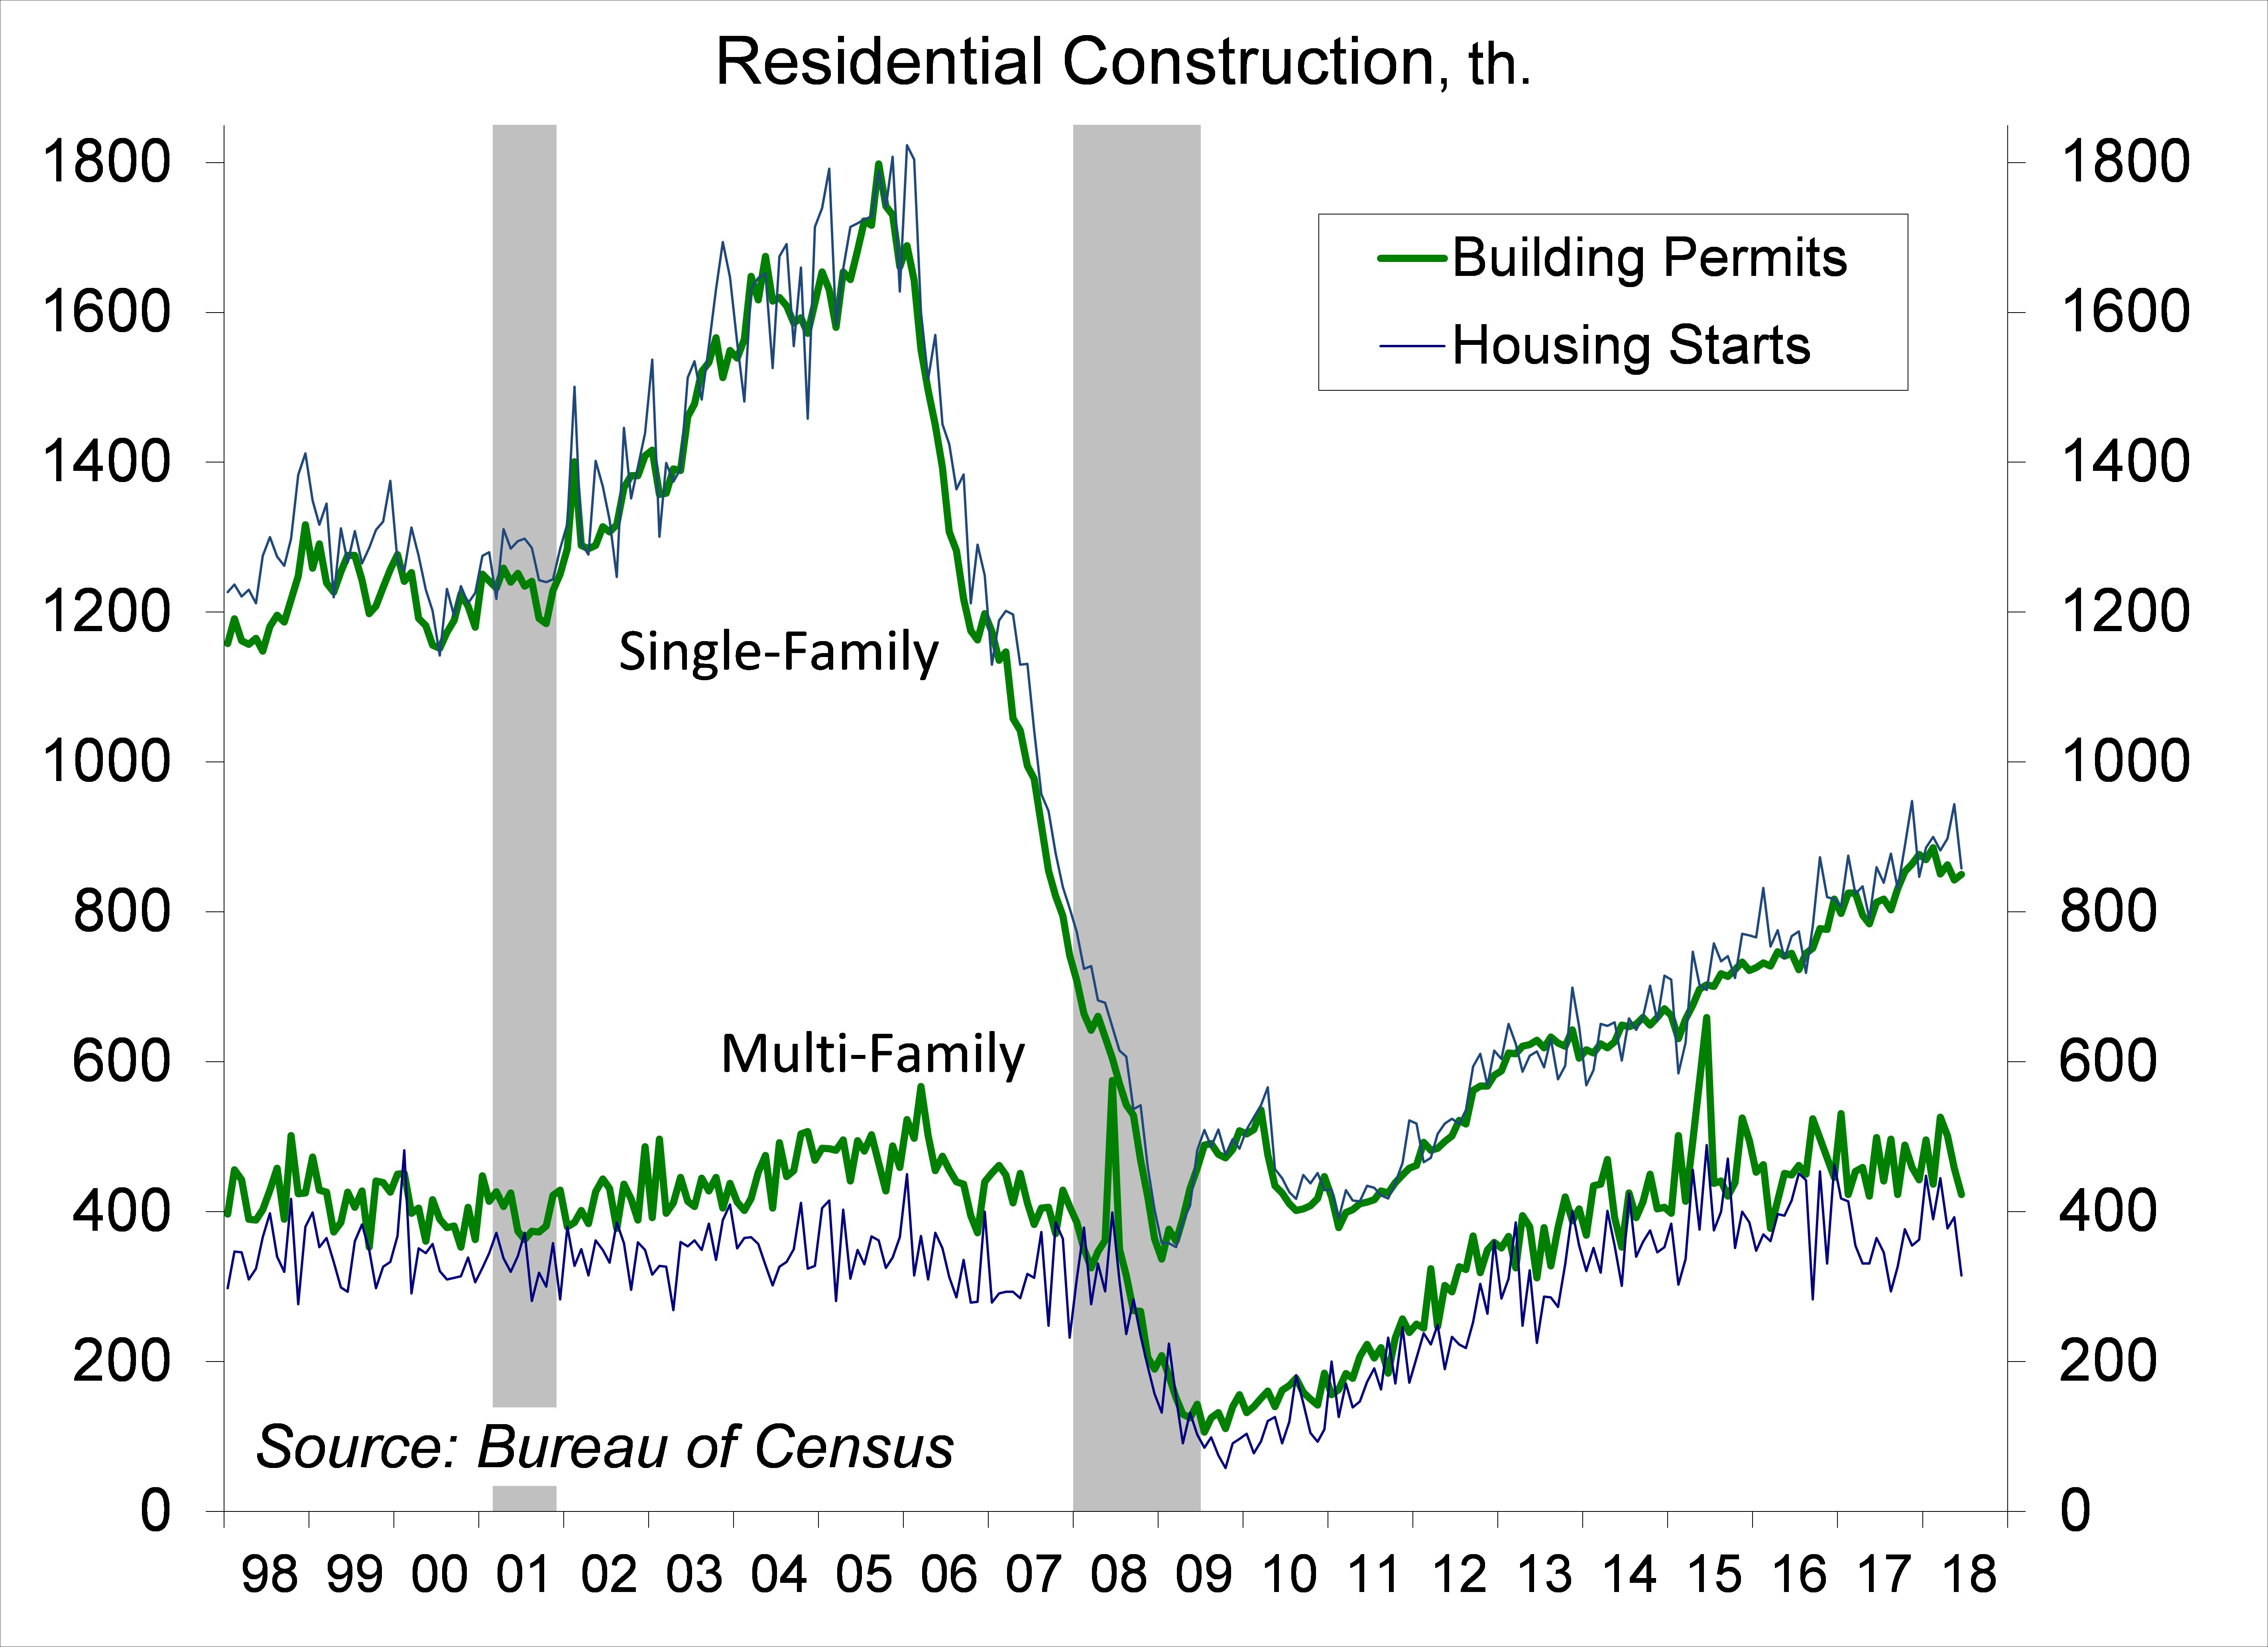
Housing starts fell sharply in June, but these data are unreliable (they are reported with a gigantic amount of statistical uncertainty). Single-family permits, the key figure in the report, are still exhibiting good strength relative to last year (+6.7% y/y for 2Q18). Builders note strong demand for housing, but high building costs (including lumber, reflecting the impact of tariffs).
We are still missing foreign trade figures for June, but it looks like the trade deficit will have fallen sharply in the second quarter. Hence, net exports should make a significant positive contribution to 2Q18 GDP growth. That drop does not reflect an impact from trade policy. Quarterly trade figures are always uneven and the trade deficit widened sharply in the previous two quarters.
To date, while increased tariffs have had a significant impact on certain industries, the impact on the overall economy is tiny. However, that is expected to change as the trade wars heats up. The White House imposed 25% tariffs on $34 billion in Chinese goods on July 6. China, as promised, retaliated, and the U.S., also as promised, moved toward retaliation against the Chinese retaliation. Some see this as a negotiating ploy. However, some, including President Trump, see higher tariffs as a means to themselves – a way to “correct” trade imbalances. This is a big mistake. Tariffs are not why the U.S. runs large trade deficits – it is because the U.S. consumes more than it produces (or equivalently, we don’t save enough).
In the Fed’s Beige Book, the anecdotal summary of economic conditions across the country, “manufacturers in all districts expressed concern about tariffs and in many districts reported higher prices and supply disruptions that they attributed to the new trade policies.” In its updated World Economic Outlook, the IMF remained optimistic about global growth for this year and next, but cautioned the balance of risks has “shifted further to the downside, including in the short term.” The IMF went on, “announced and anticipated tariff increases by the United States and retaliatory measures by trading partners have increased the likelihood of escalating and sustained trade actions,” which “could derail the recovery and depress medium-term growth prospects, both through their direct impact on resource allocation and productivity and by raising uncertainty and taking a toll on investment.”
The fallout of trade tariffs is front page news and will weigh against consumer and business sentiment the longer trade tensions escalate. This is likely to be a crisis for Republicans in Congress as the November election approaches – and we can expect increased pressure on the White House to accept whatever concessions have been offered, declare victory, and move on, the sooner the better. However, while the White House has often walked back Trump’s controversies, the president has just as often doubled down the next day. Last week, the president criticized the Fed for raising rates – a critical (but not entirely unprecedented) faux pas – which the White House soon walked back, only to have Trump amplify his criticism the next morning. This is exhausting, and it suggests little clarity on what may happen with trade policy in the weeks and months ahead.
Chairman Powell tried to avoid discussing fiscal and trade policy in his monetary policy testimony (“we need to stay in our lane”). However, he said that the Fed does have to account for the impact of policy changes on the economy. Tax and spending policies should continue to support the expansion, according to Powell, but it’s hard to say how much. He supported having a rules-based system for trade policy and noted that countries that haven’t erected trade barriers have generally grown faster, while “countries that have gone in a more protectionist direction have done worse.”
Data Recap – Powell’s monetary policy testimony was uneventful and the economic data reports weren’t especially market-moving. Trade policy concerns continued to boil, as President Trump threatened to impose tariffs on everything coming from China.
The White House’s Office of Management and Budget raised its forecast of the FY18 Federal Budget Deficit to $890 billion (4.4% of GDP) and boosted its expectations of the FY19 shortfall to $1.085 trillion (5.1% of GDP).
In a CNBC interview, President Trump criticized the Federal Reserve, saying that “we go up [the economy improves] and every time you go up they want to raise rates again – I am not happy about it.” Presidential criticism of the central bank (in public) is historically rare, and for good reason. The White House later clarified that “the President respects the independence of the Fed.” The next morning, Trump doubled down, tweeting “China, the European Union and others have been manipulating their currencies and interest rates lower, while the U.S. is raising rates while the dollars gets stronger and stronger with each passing day – taking away our big competitive edge. As usual, not a level playing field. The United States should not be penalized because we are doing so well. Tightening now hurts all that we have done. The U.S. should be allowed to recapture what was lost due to illegal currency manipulation and BAD Trade Deals. Debt coming due & we are raising rates – really?”
In his monetary policy testimony to Congress, Fed Chairman Jay Powell said that “with a strong job market, inflation close to our objective, and the risks to the outlook roughly balanced, the FOMC believes that – for now – the best way forward is to keep gradually raising the federal funds rate.” The addition of the qualifier “for now” indicates that Fed officials could alter the policy path expectations if conditions change. Powell said that “it is difficult to predict the ultimate outcome of current discussions over trade policy as well as the size and timing of the economic effects of the recent changes in fiscal policy.”
The Fed’s Beige Book reported growth as “modest to moderate” in 10 of the 12 Federal Reserve districts. The Dallas district was strong, reflecting the energy sector, while growth in the St. Louis district was described as “slight.” More importantly, “manufacturers in all districts expressed concern about tariffs and in many districts reported higher prices and supply disruptions that they attributed to the new trade policies.” Labor markets were described as “tight,” with most districts reporting that “firms had difficulty finding qualified labor.” Labor shortages were cited across a wide range of occupations, including highly skilled engineers, specialized construction and manufacturing workers, IT professionals, and truck drivers. Some districts indicated that labor shortages were constraining growth. Firms were “adding work hours, strengthening retention efforts, partnering with local schools, and converting temporary workers to permanent, as well as raising compensation to attract and retain employees.” On balance, “wage increases were modest to moderate, with some differences across sectors.” A couple of districts cited a pickup in the pace of wage growth. Prices increased in all districts at a pace that was “modest to moderate on average.” Reports showed upticks in inflation in several districts. Prices of key inputs rose further, including fuel, construction materials, freight, and metals; a few districts described these input price pressures as elevated or strong. Tariffs contributed to the increases for metals and lumber. However, the extent of pass-through from input to consumer prices remained slight to moderate. Movements in agricultural commodities prices were mixed across products and districts. Pricing pressures are expected to intensify further moving forward in some districts, while in others “the outlook is for stable price increases at a modest to moderate pace.”
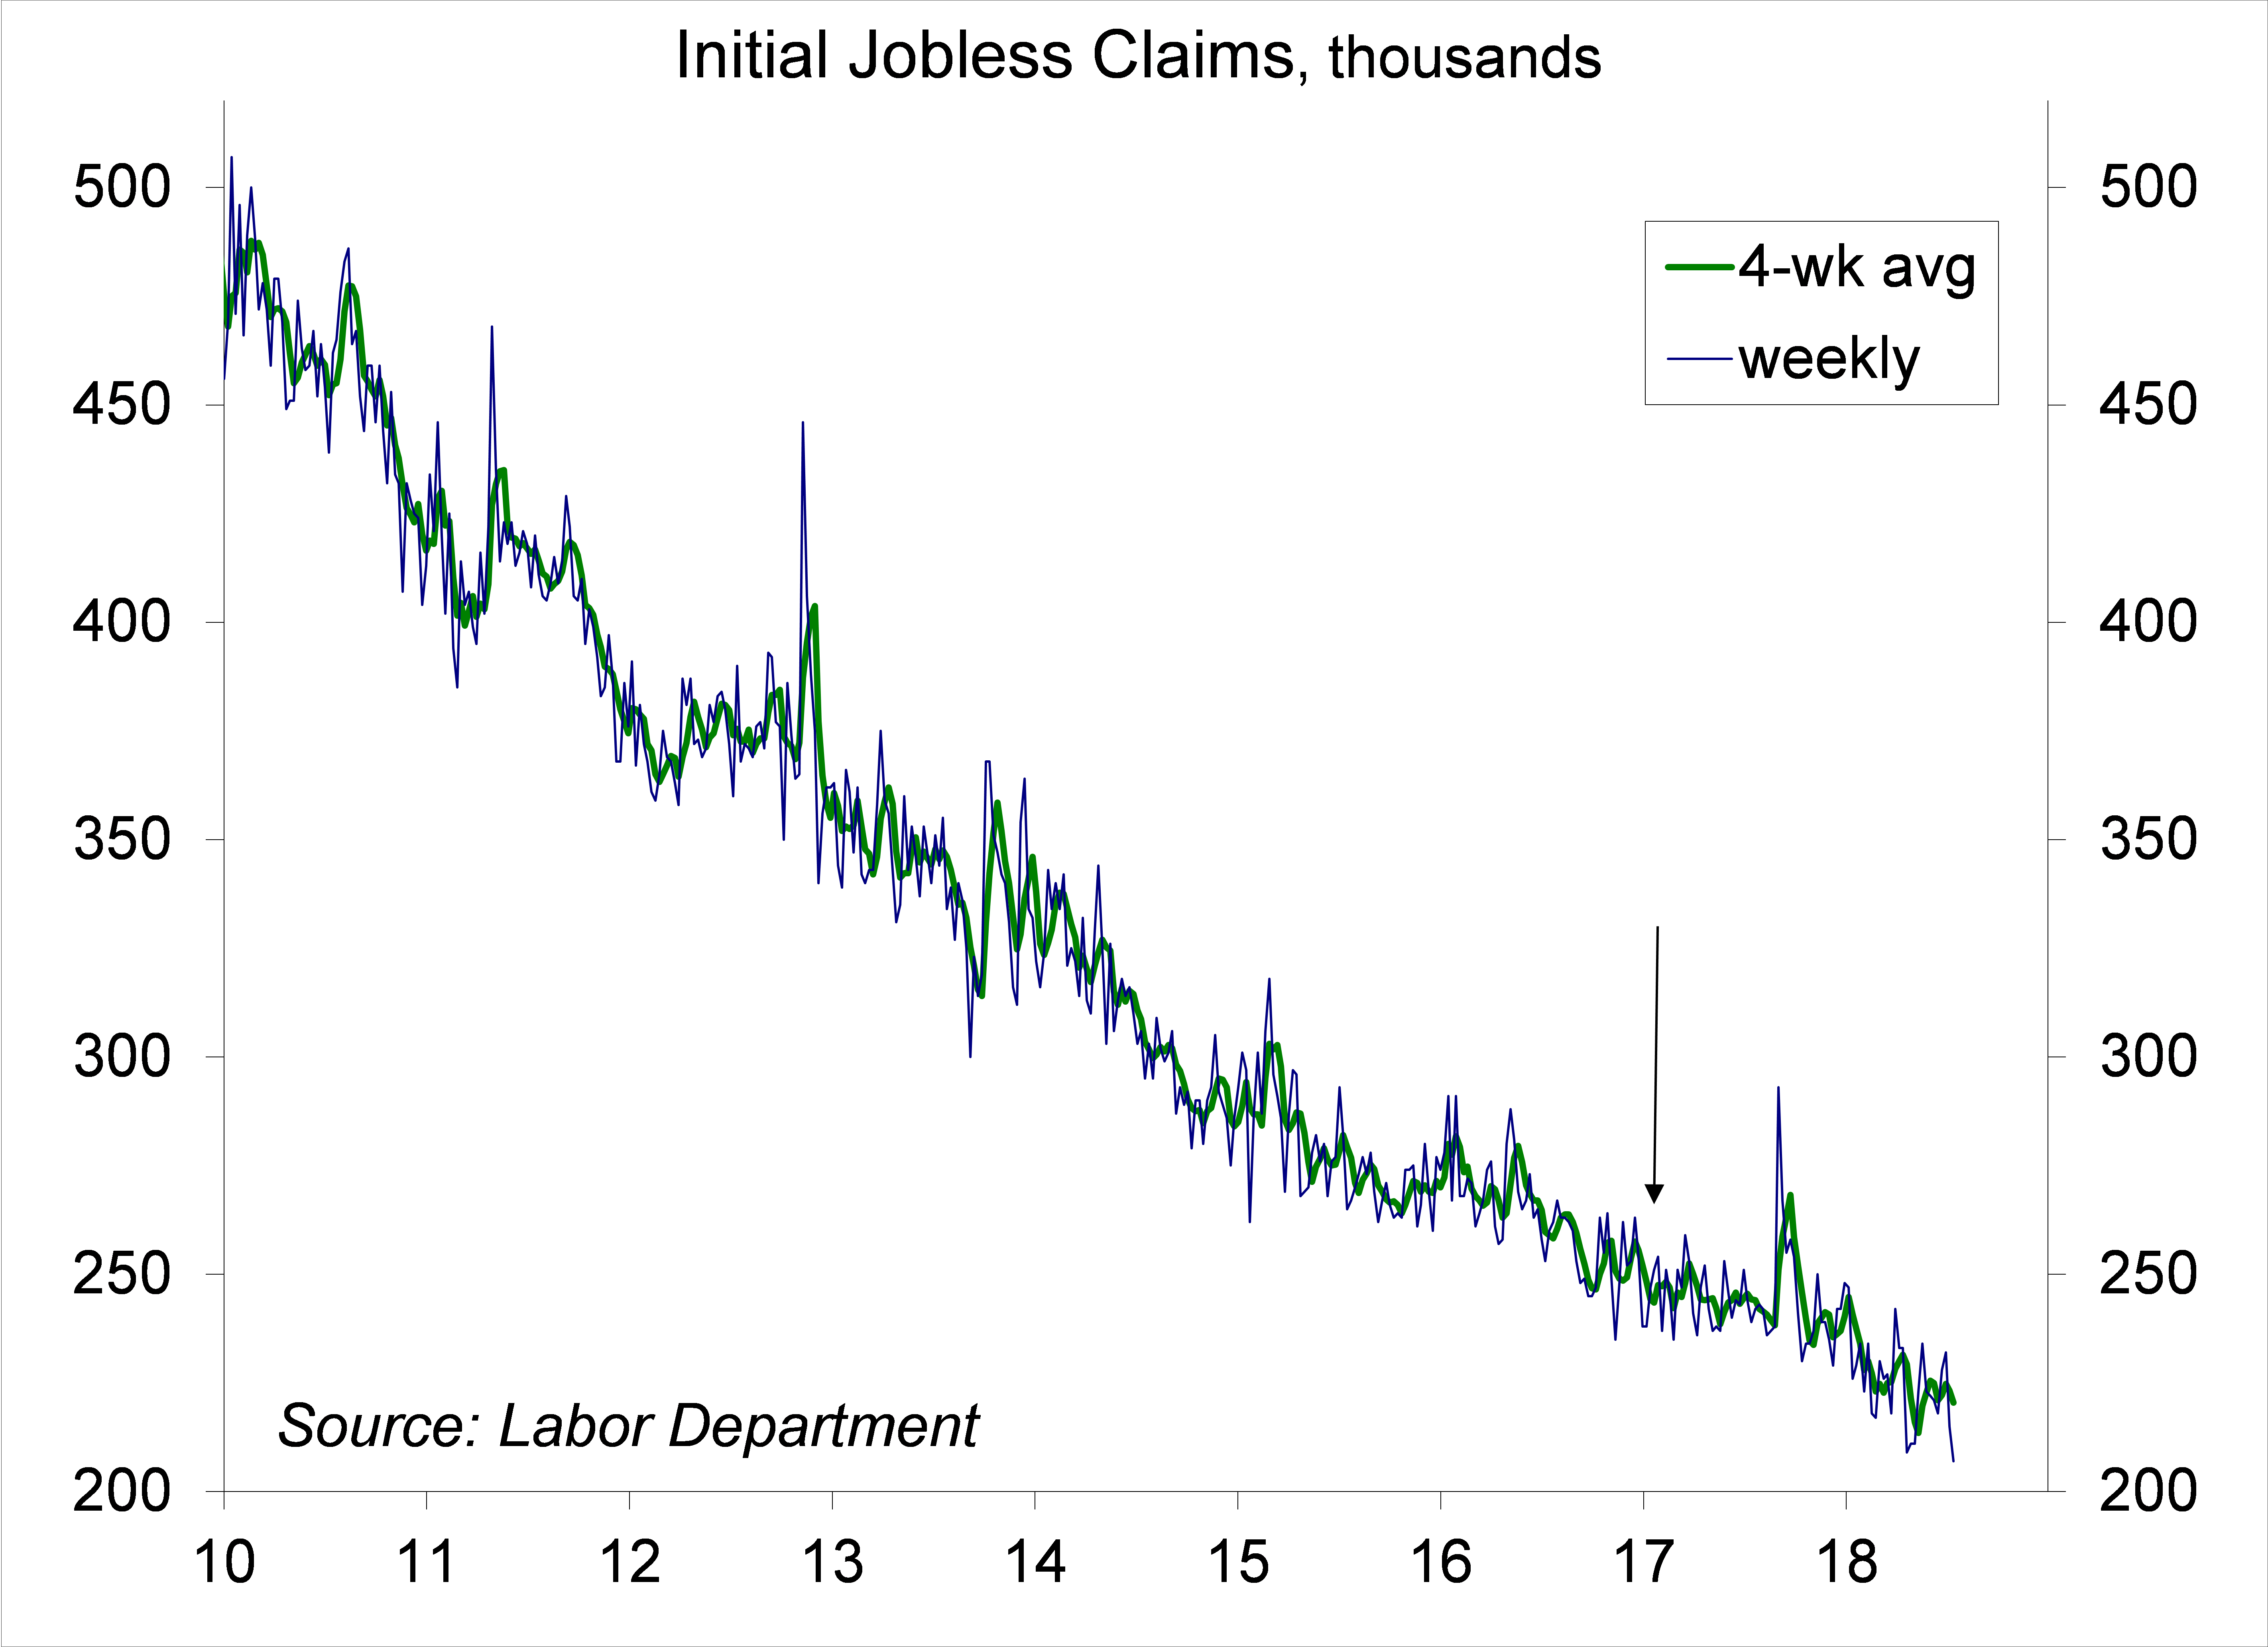
Jobless Claims fell by 8,000 in the week ending July 14, to 207,000 – the lowest since December 6, 1969 (when the size of the labor force was about half of the size that it is now. The figures are subject to distortions in early July, reflecting difficulties in seasonal adjustment around summer auto plant shutdowns, the end of the school year, and the Independence Day holiday.
Chart 1
Chart 2
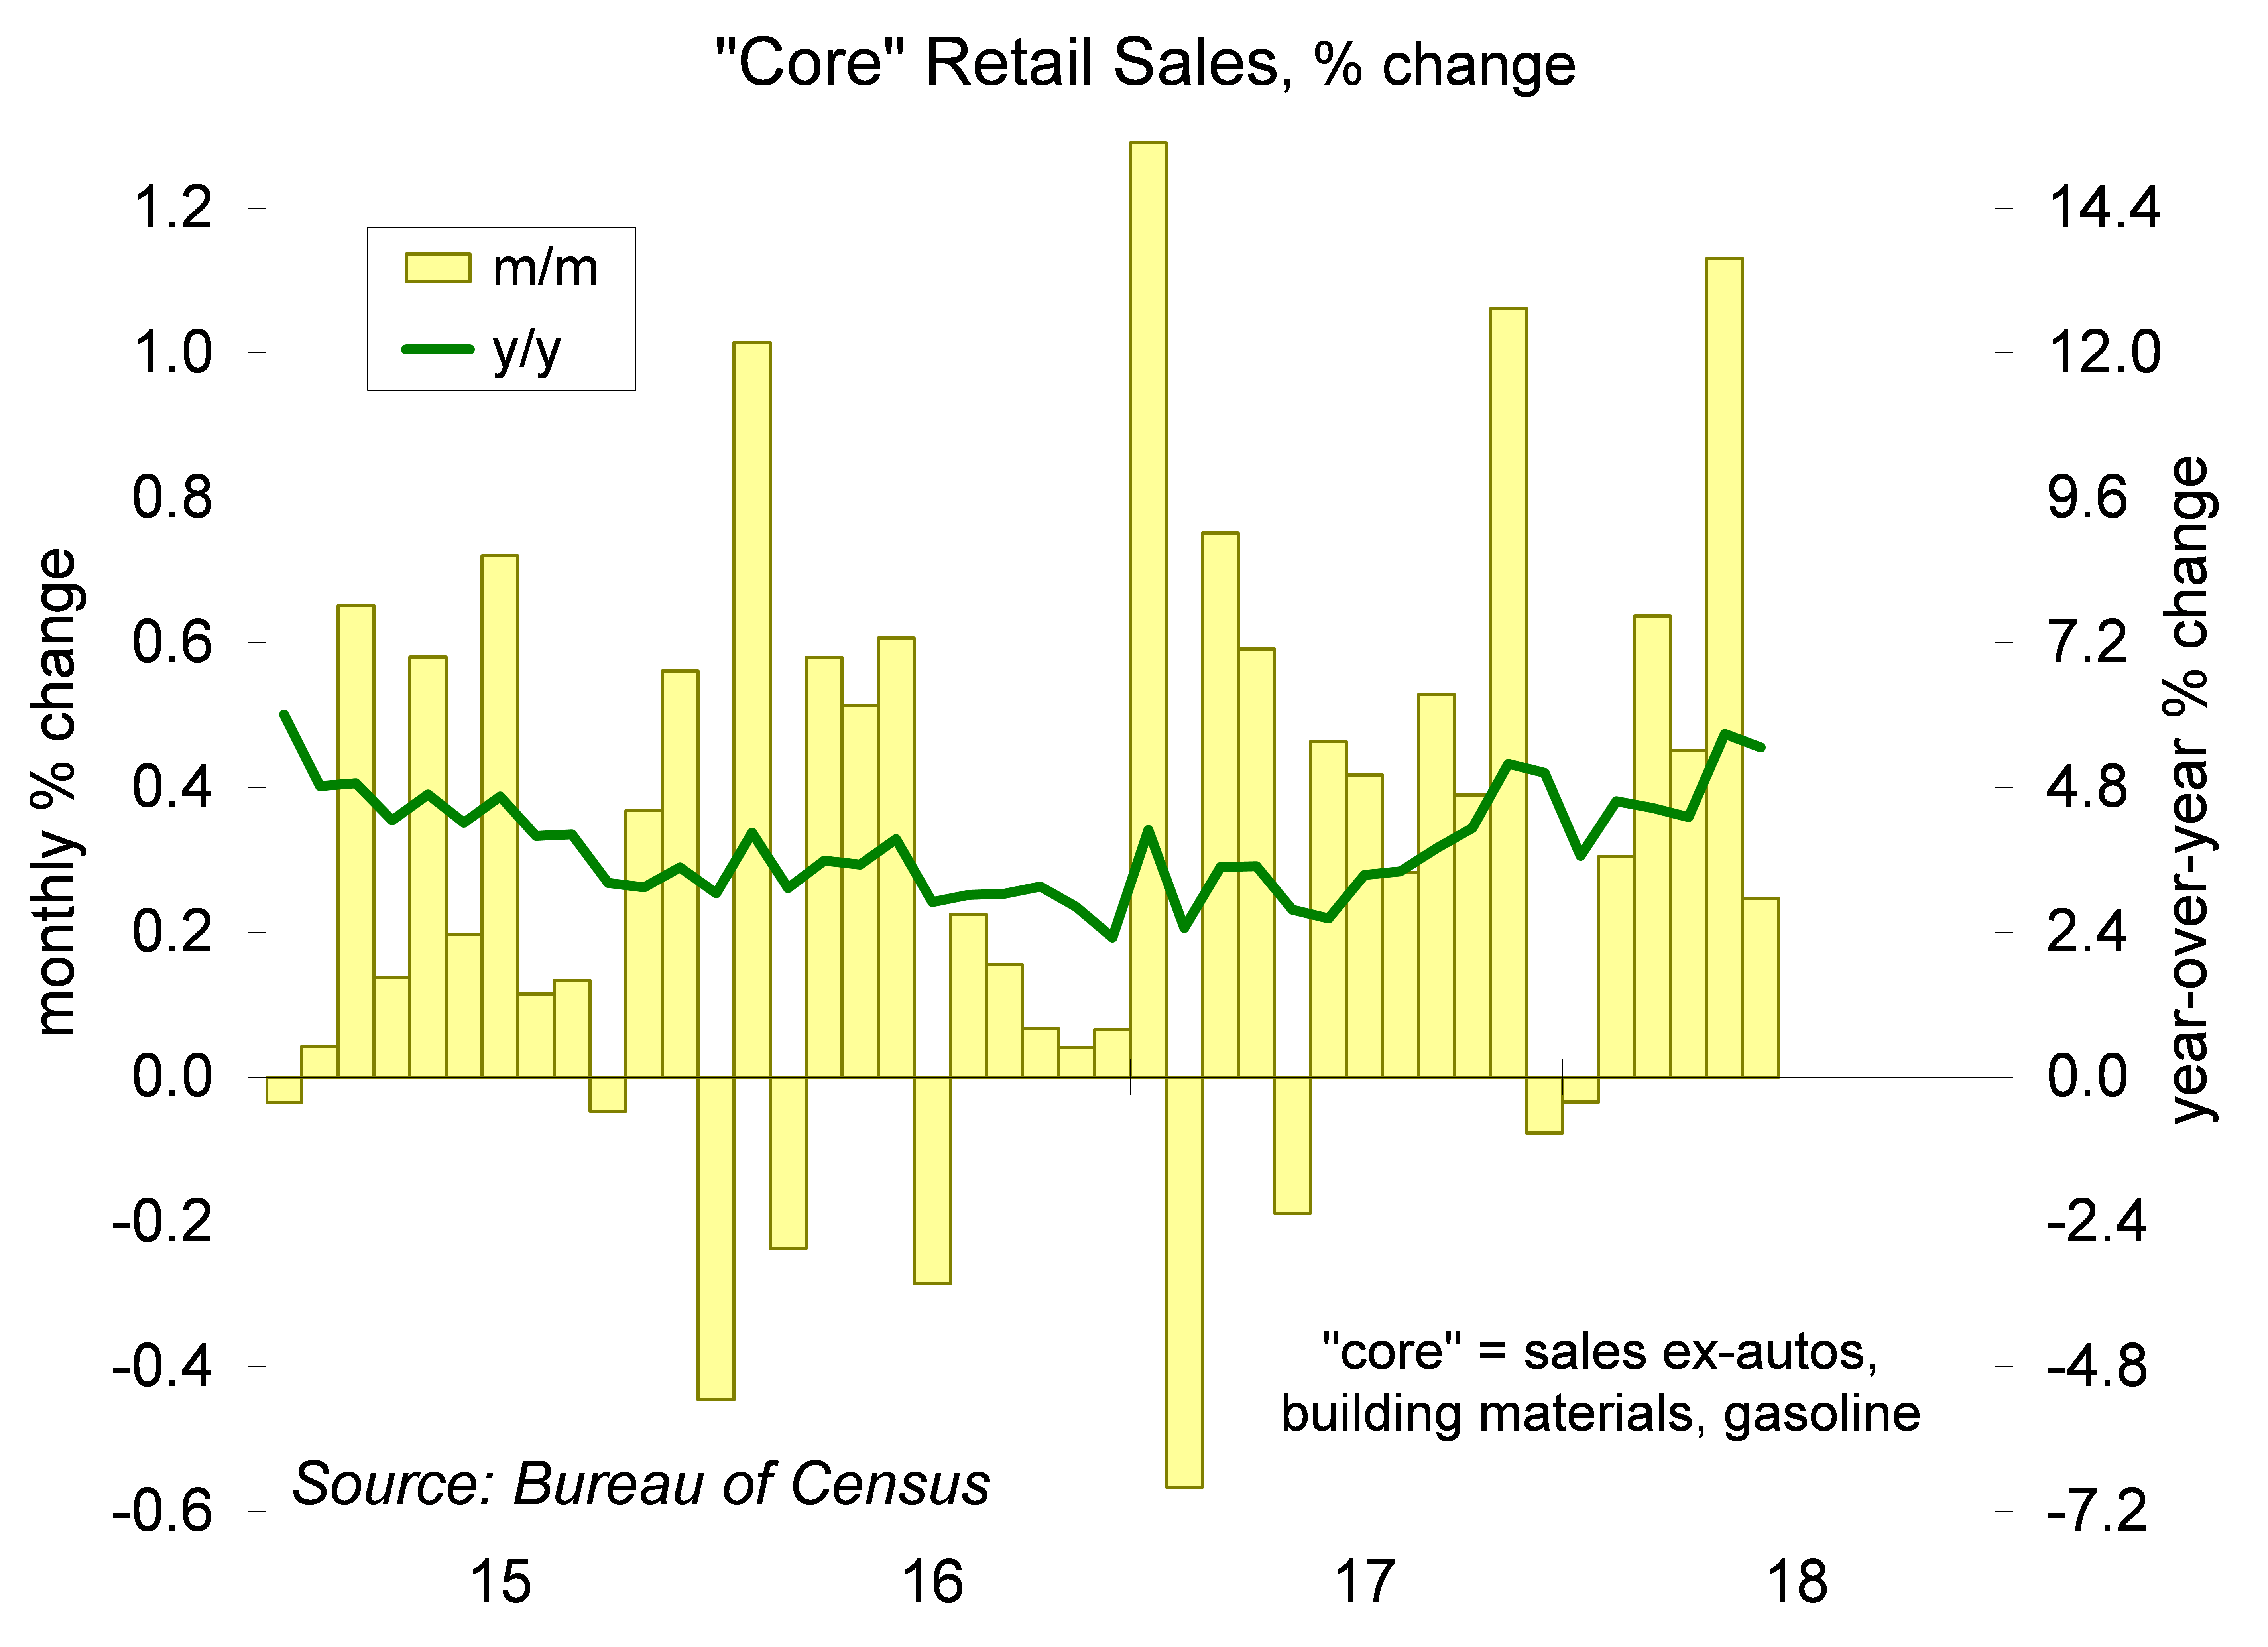
Retail Sales rose 0.5% in the initial estimate for June (+6.6% y/y), following a 1.3% rise in May (revised from +0.8%). Sales rose 0.4% ex-autos (+7.1% y/y), also with an upward revision to May. Core retail sales (which exclude autos, building materials, and gasoline) rose 0.2% (+5.5%), with upward revisions to April and May – a 7.5% annual rate in 2Q18 (vs. +2.8% in 1Q18).
Business Inventories rose 0.4% in May (+4.4% y/y). Retail inventories, the only new information in this report, rose 0.4% (autos +0.9%, ex-autos +0.1%). Manufacturing inventories (reported earlier) rose 0.2% and wholesale inventories rose 0.6%. Business sales (factory shipments plus wholesale and retail sales) rose 1.4% in May, up 8.6% y/y.
Industrial Production rose 0.6% in June (+3.8% y/y), following a 0.5% drop in May, reflecting a rebound from a fire at an auto parts supplier. The output of utilities fell 1.5% (+4.0% y/y). Mining rose 1.2%, with oil and gas well drilling up 2.9% (+11.4% y/y). Energy extraction rose 1.9% (+16.7% y/y). Manufacturing output rose 0.8% (+2.1% y/y), reflecting a 7.8% rebound in auto production (+3.7% y/y). Ex-autos, factory output rose 0.3%, following a 0.4% drop in May (+1.8% y/y). Iron and steel production fell 0.8%, down 3.5% over the last three months. Factory output rose at a 1.9% annual rate in 2Q18, the same moderate pace as in 1Q18 (vs. +2.1% 4Q17/4Q16). Capacity utilization rose to 78.0%, vs. 77.7% in May and 78.2% in April, consistent with moderate inflationary pressure.
Chart 3
Chart 4
Building Permits fell 2.2% (±1.2%) in June, to a seasonally adjusted 1.273 million annual rate (-3.0% y/y). Single-family permits, the key figure in the report rose 0.8% (±1.5), up 6.7% y/y for the second quarter (+4.0% in the Northeast, +3.6% in the Midwest, +7.3% in the South, and +7.9% in the West). Housing Starts fell 12.3% (±8.3%) to a 1.173 million pace (-4.2% y/y).
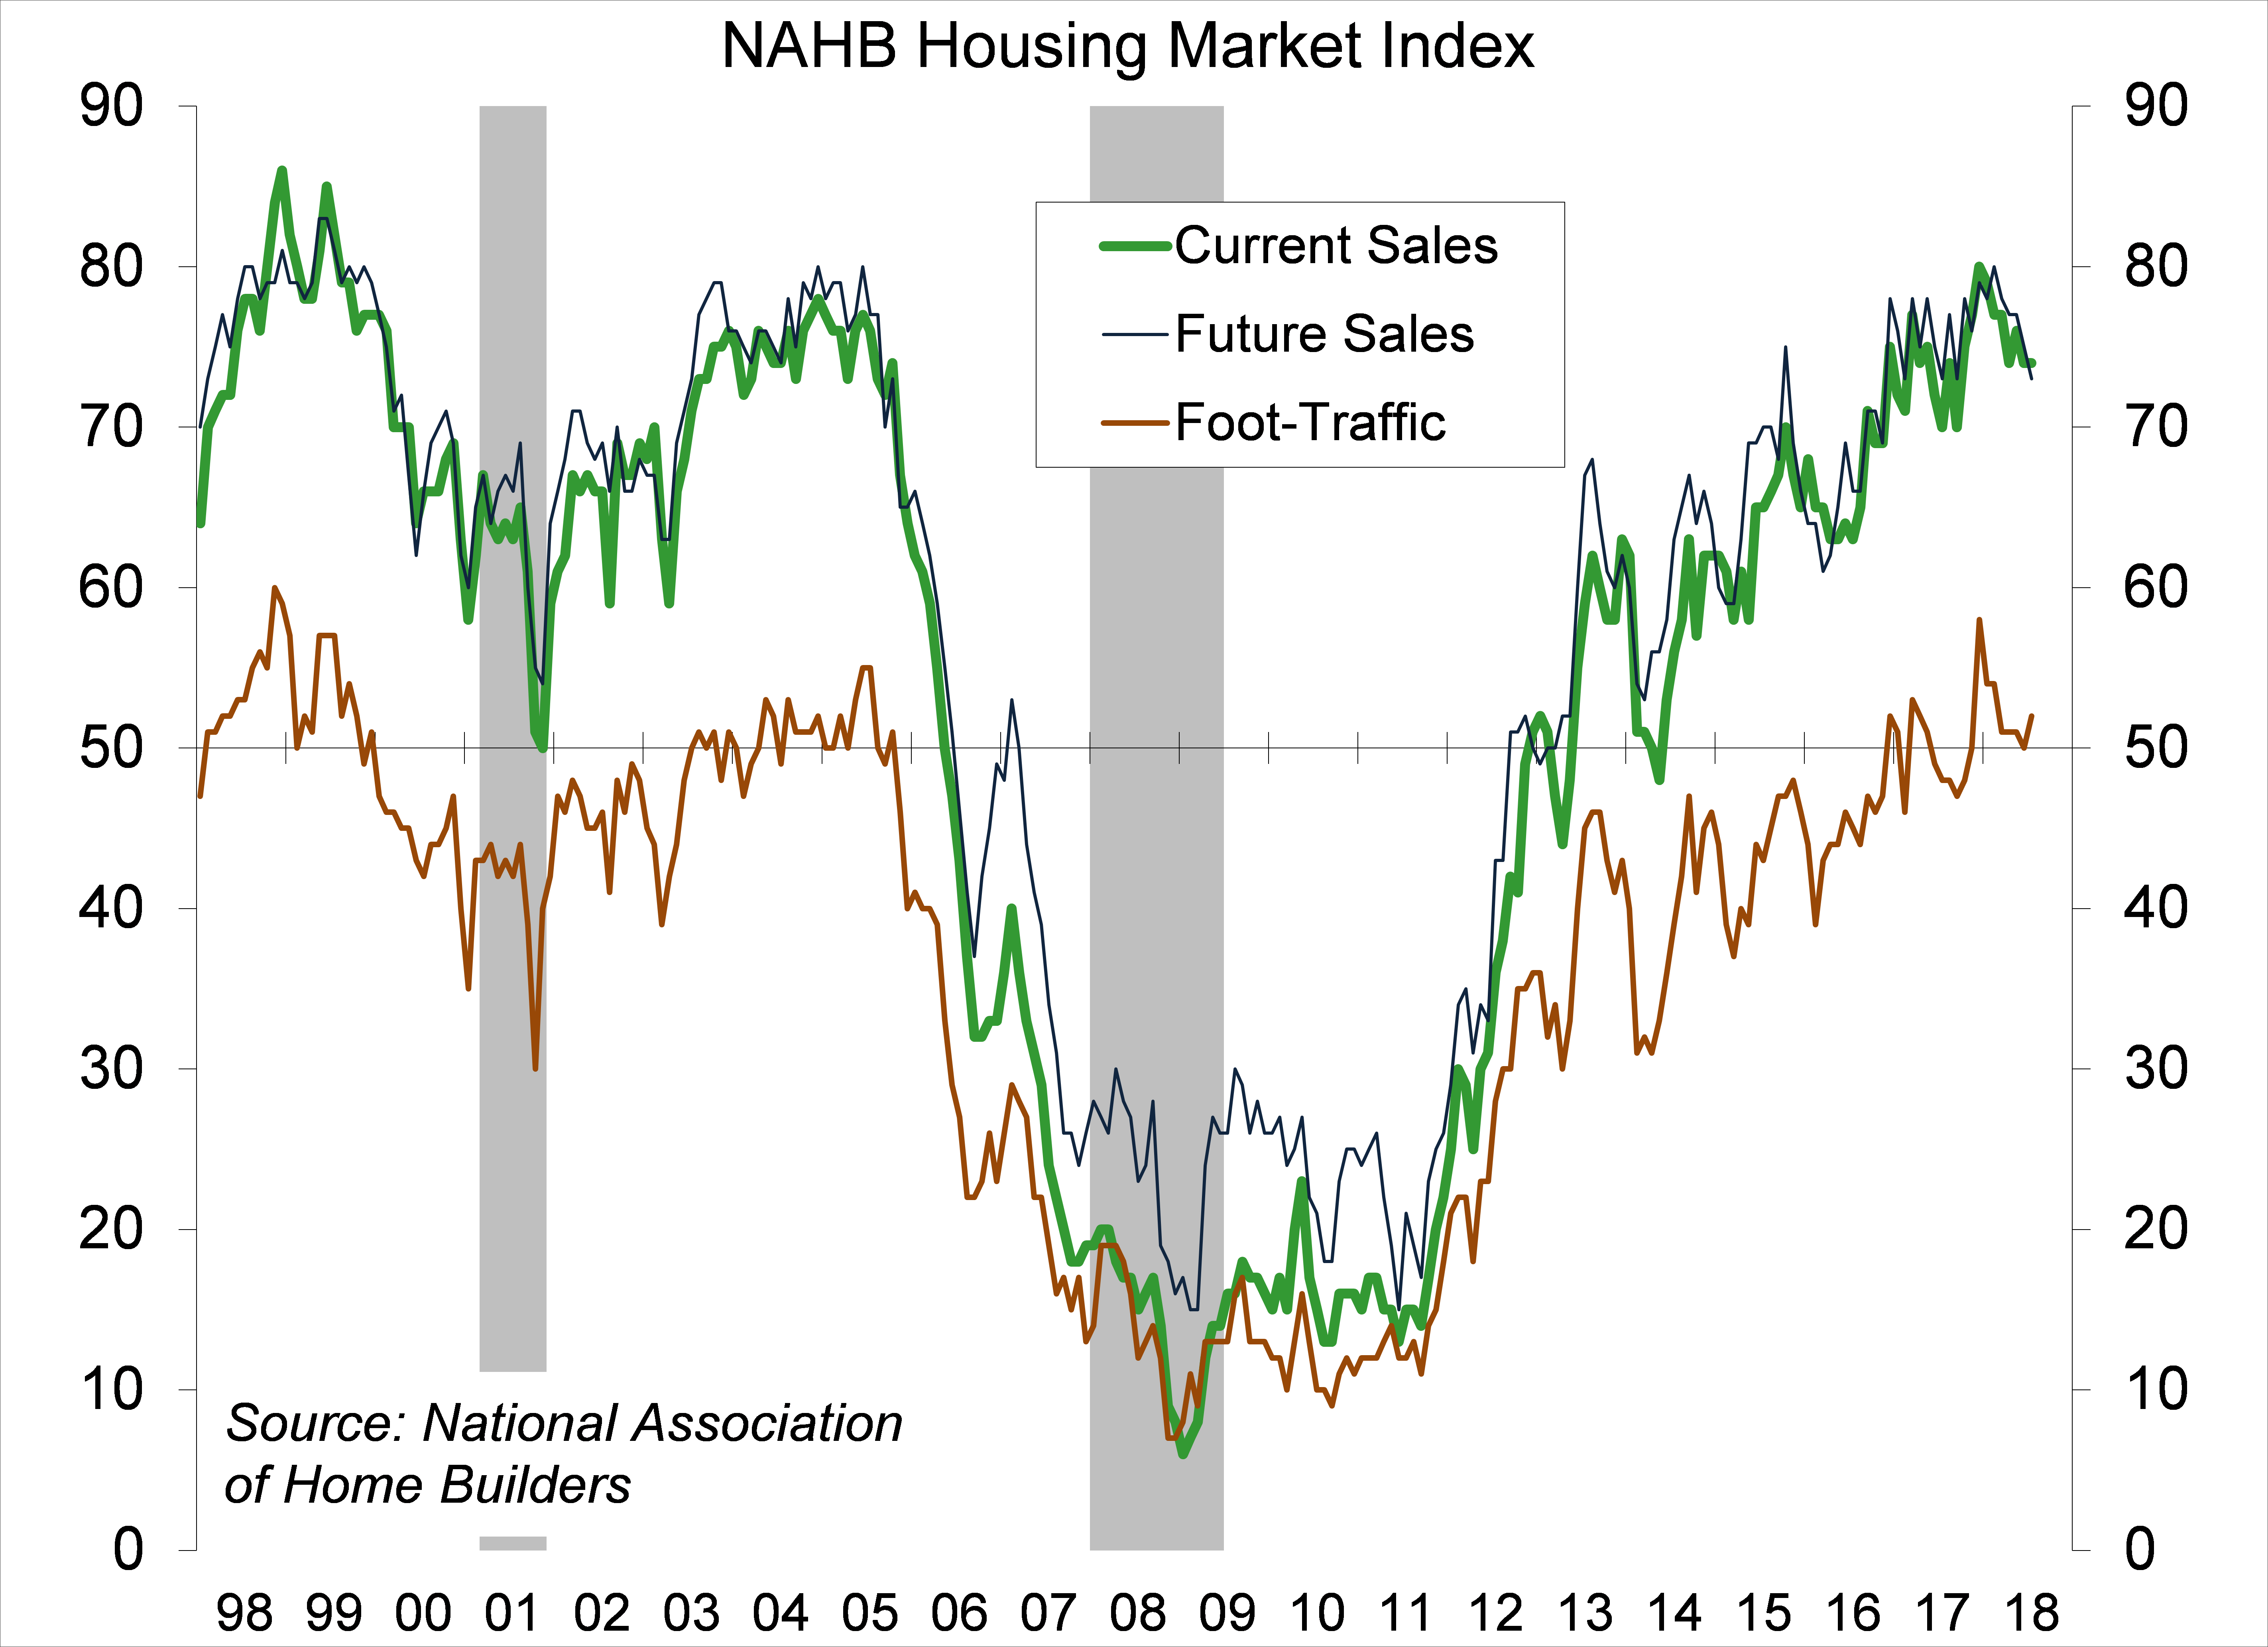
Homebuilder Sentiment (the National Association of Home Builders Housing Market Index) held steady at 68 in July. Consumer demand remains strong, according to the NAHB, supported by strong job growth, income gains, and low unemployment in many parts of the country. However, builders “continue to be burdened by rising construction material costs.”
Chart 5
Chart 6
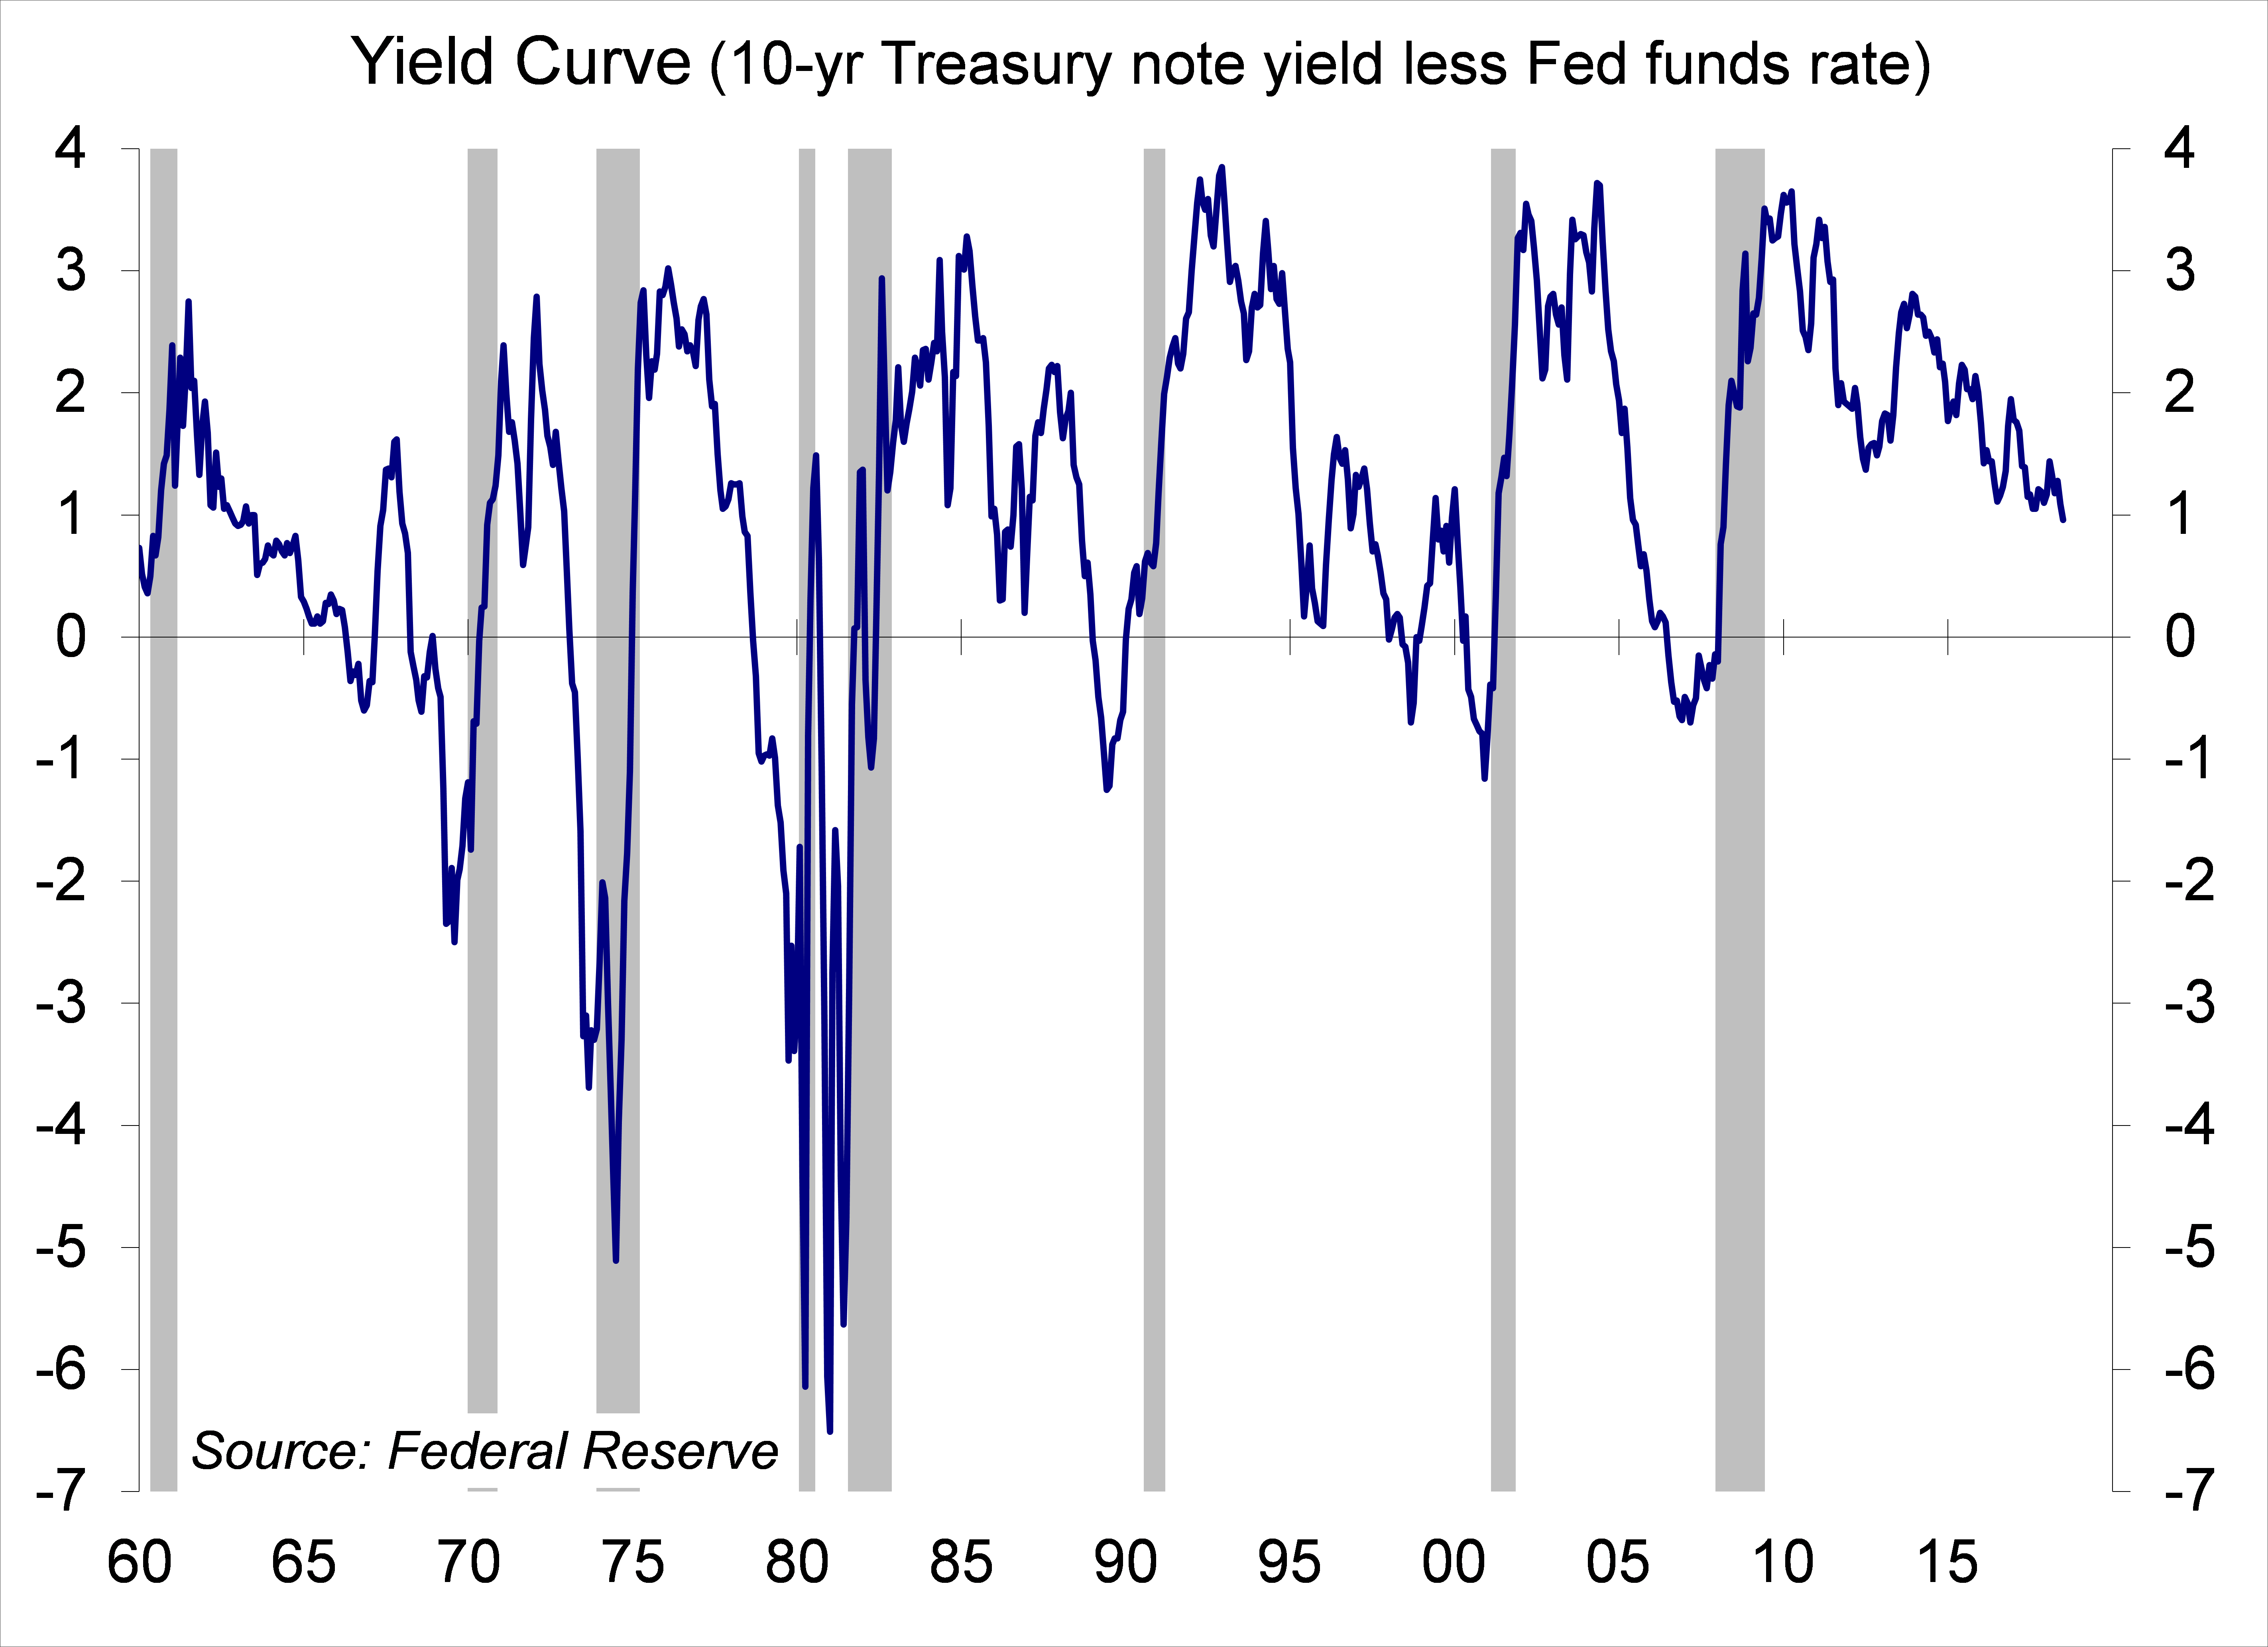
The Index of Leading Economic Indicators rose 0.5% in June, following no change in May (revised from +0.2%). Positive contributions were led by ISM new orders, the yield curve, and stock prices. Building permits made the only negative contribution.
In its updated World Economic Outlook, the IMF left global growth forecasts unchanged from the April projections (+3.8% 4Q/4Q growth for both 2018 and 2019), but the IMF cautioned that “the expansion is becoming less even, and risks to the outlook are mounting.” The balance of risks has “shifted further to the downside, including in the short term.” Recently announced and anticipated tariff increases by the United States and retaliatory measures by trading partners have increased the likelihood of escalating and sustained trade actions. These could derail the recovery and depress medium-term growth prospects, both through their direct impact on resource allocation and productivity and by raising uncertainty and taking a toll on investment.”
The opinions offered by Dr. Brown should be considered a part of your overall decision-making process. For more information about this report – to discuss how this outlook may affect your personal situation and/or to learn how this insight may be incorporated into your investment strategy – please contact your financial advisor or use the convenient Office Locator to find our office(s) nearest you today.
All expressions of opinion reflect the judgment of the Research Department of Raymond James & Associates (RJA) at this date and are subject to change. Information has been obtained from sources considered reliable, but we do not guarantee that the foregoing report is accurate or complete. Other departments of RJA may have information which is not available to the Research Department about companies mentioned in this report. RJA or its affiliates may execute transactions in the securities mentioned in this report which may not be consistent with the report’s conclusions. RJA may perform investment banking or other services for, or solicit investment banking business from, any company mentioned in this report. For institutional clients of the European Economic Area (EEA): This document (and any attachments or exhibits hereto) is intended only for EEA Institutional Clients or others to whom it may lawfully be submitted. There is no assurance that any of the trends mentioned will continue in the future. Past performance is not indicative of future results.


