The July Employment Report
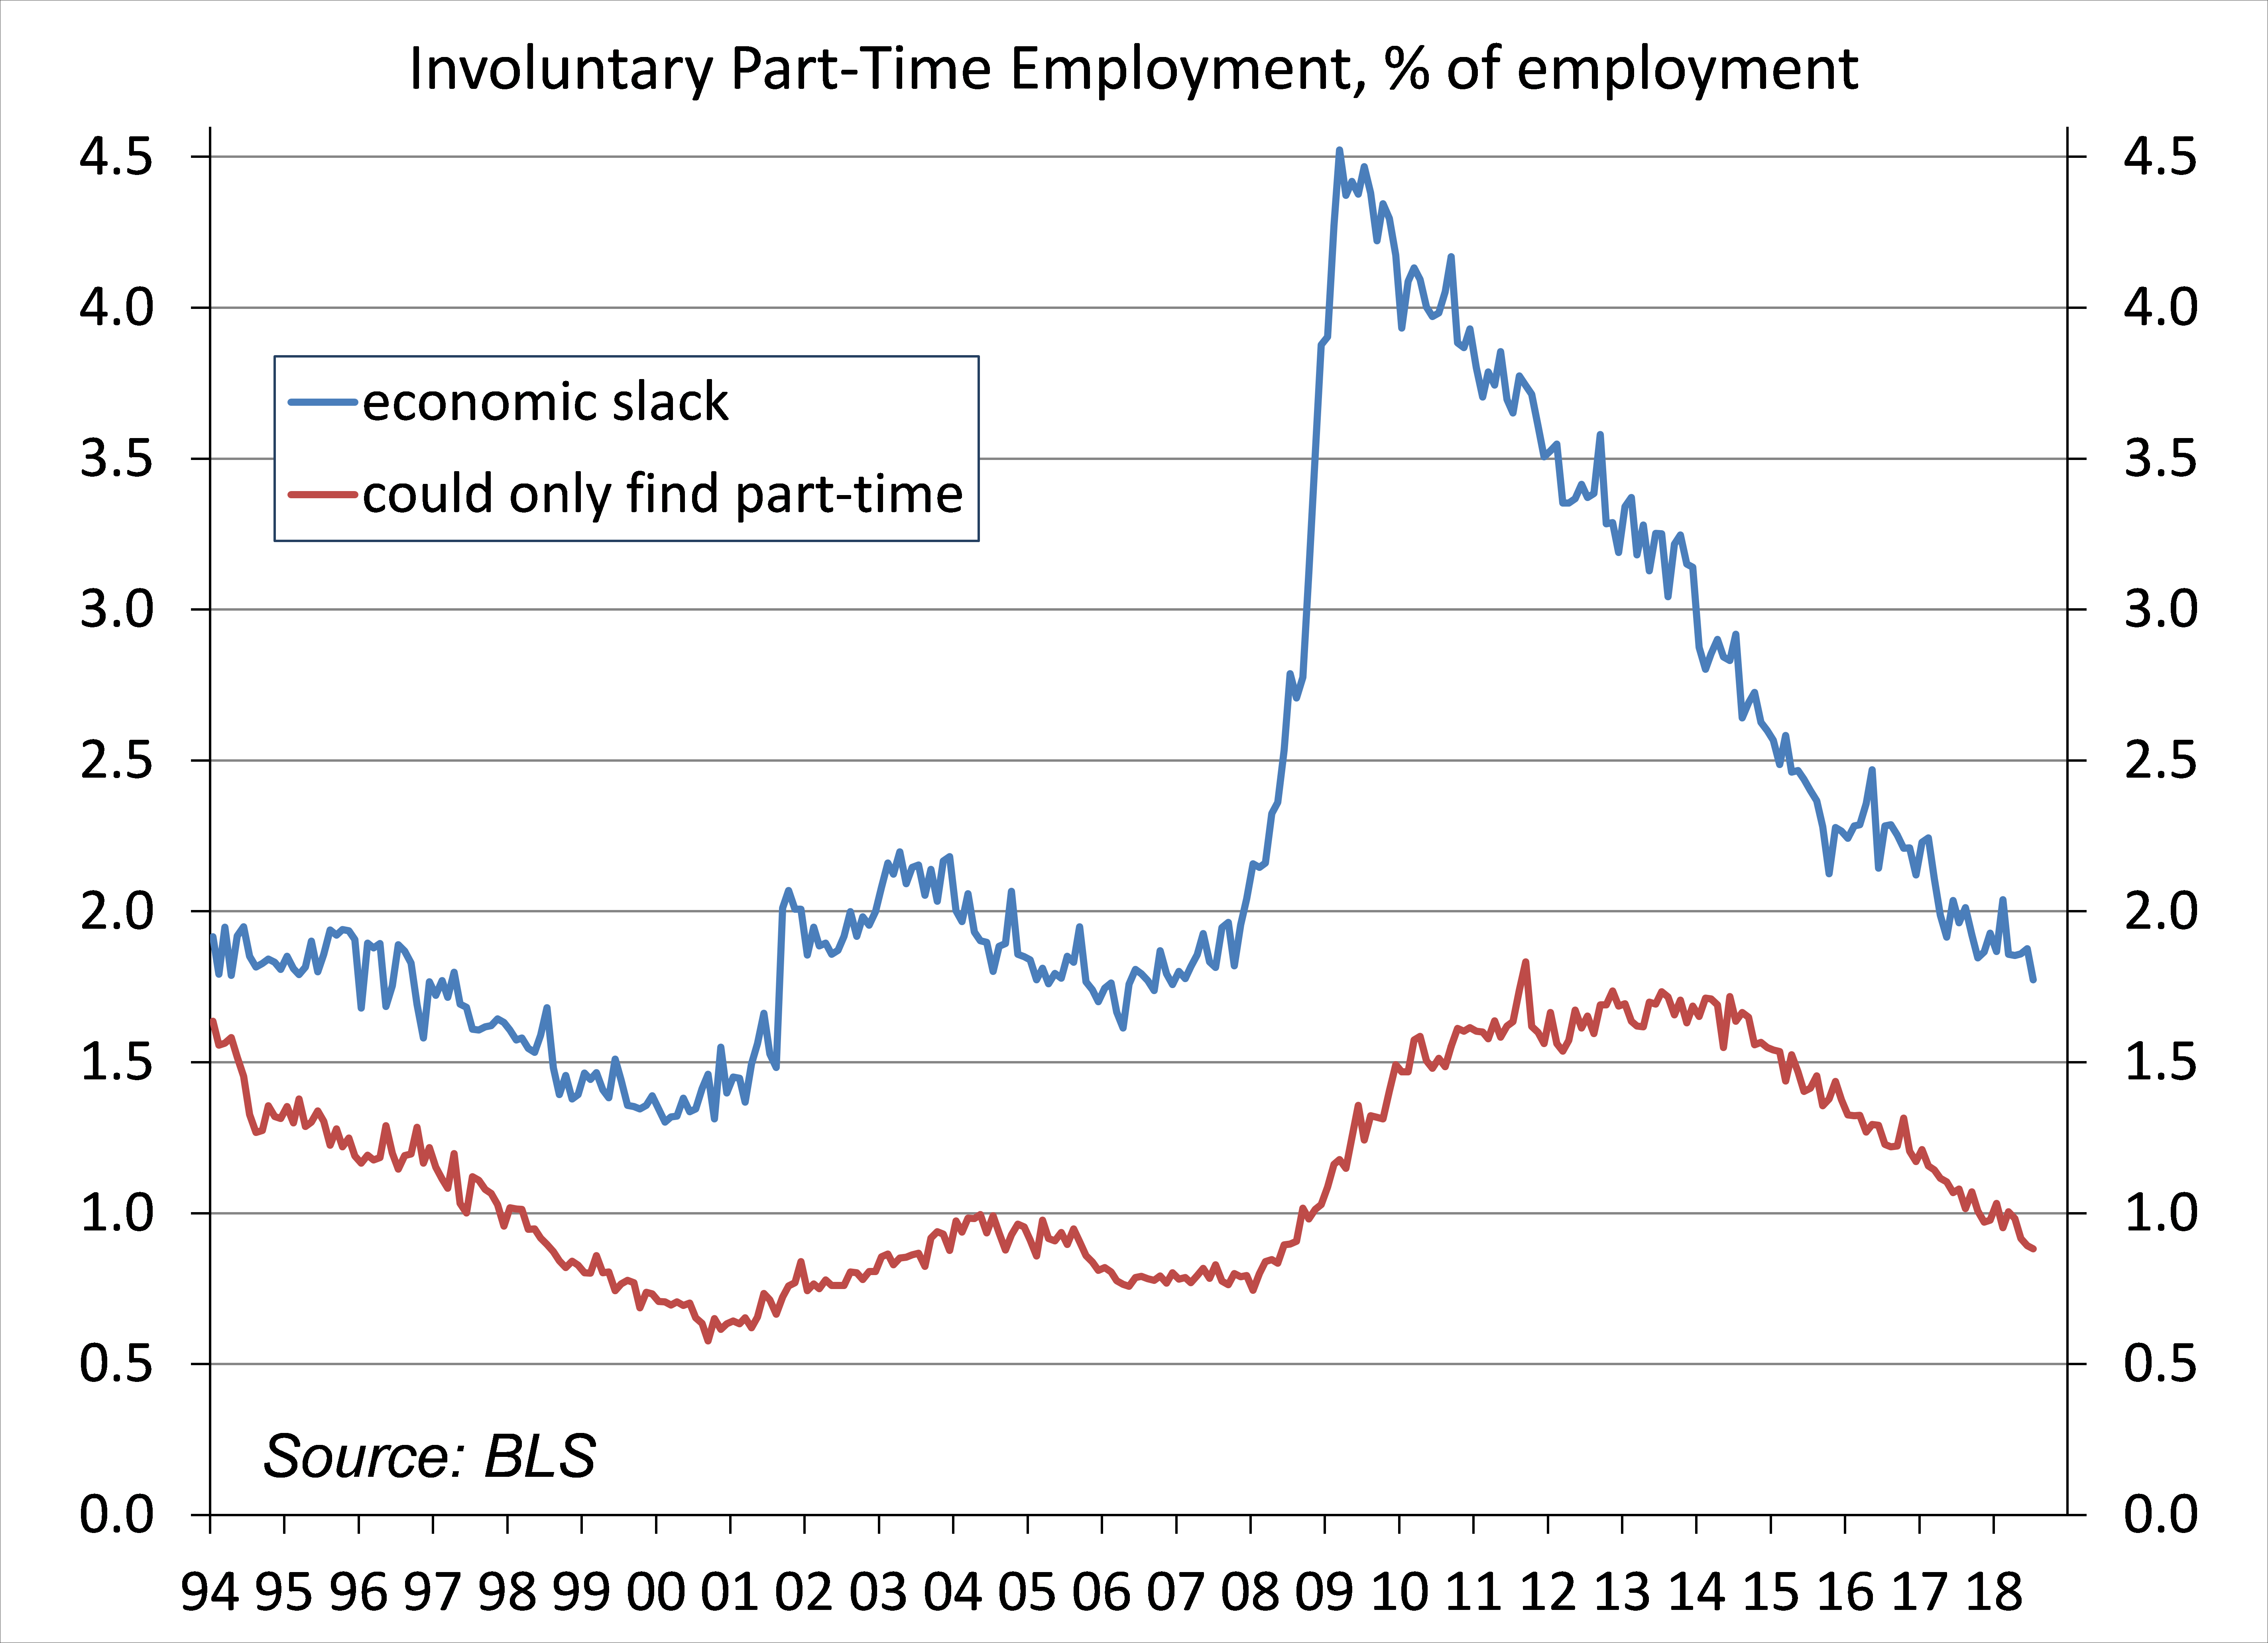
Nonfarm payrolls rose less than anticipated in the initial estimate for July, but figures for May and June were revised higher. The unemployment rate edged down, but the trend has been relatively flat this year – at odds with the strong trend in nonfarm payrolls. Measures of underemployment are falling. Wage growth remains moderate, more than offset by inflation, but that reflects higher gasoline prices, which are likely to moderate in the near term. For Federal Reserve policymakers, the report was consistent with further gradual increases in short-term interest rates.
Chart 2
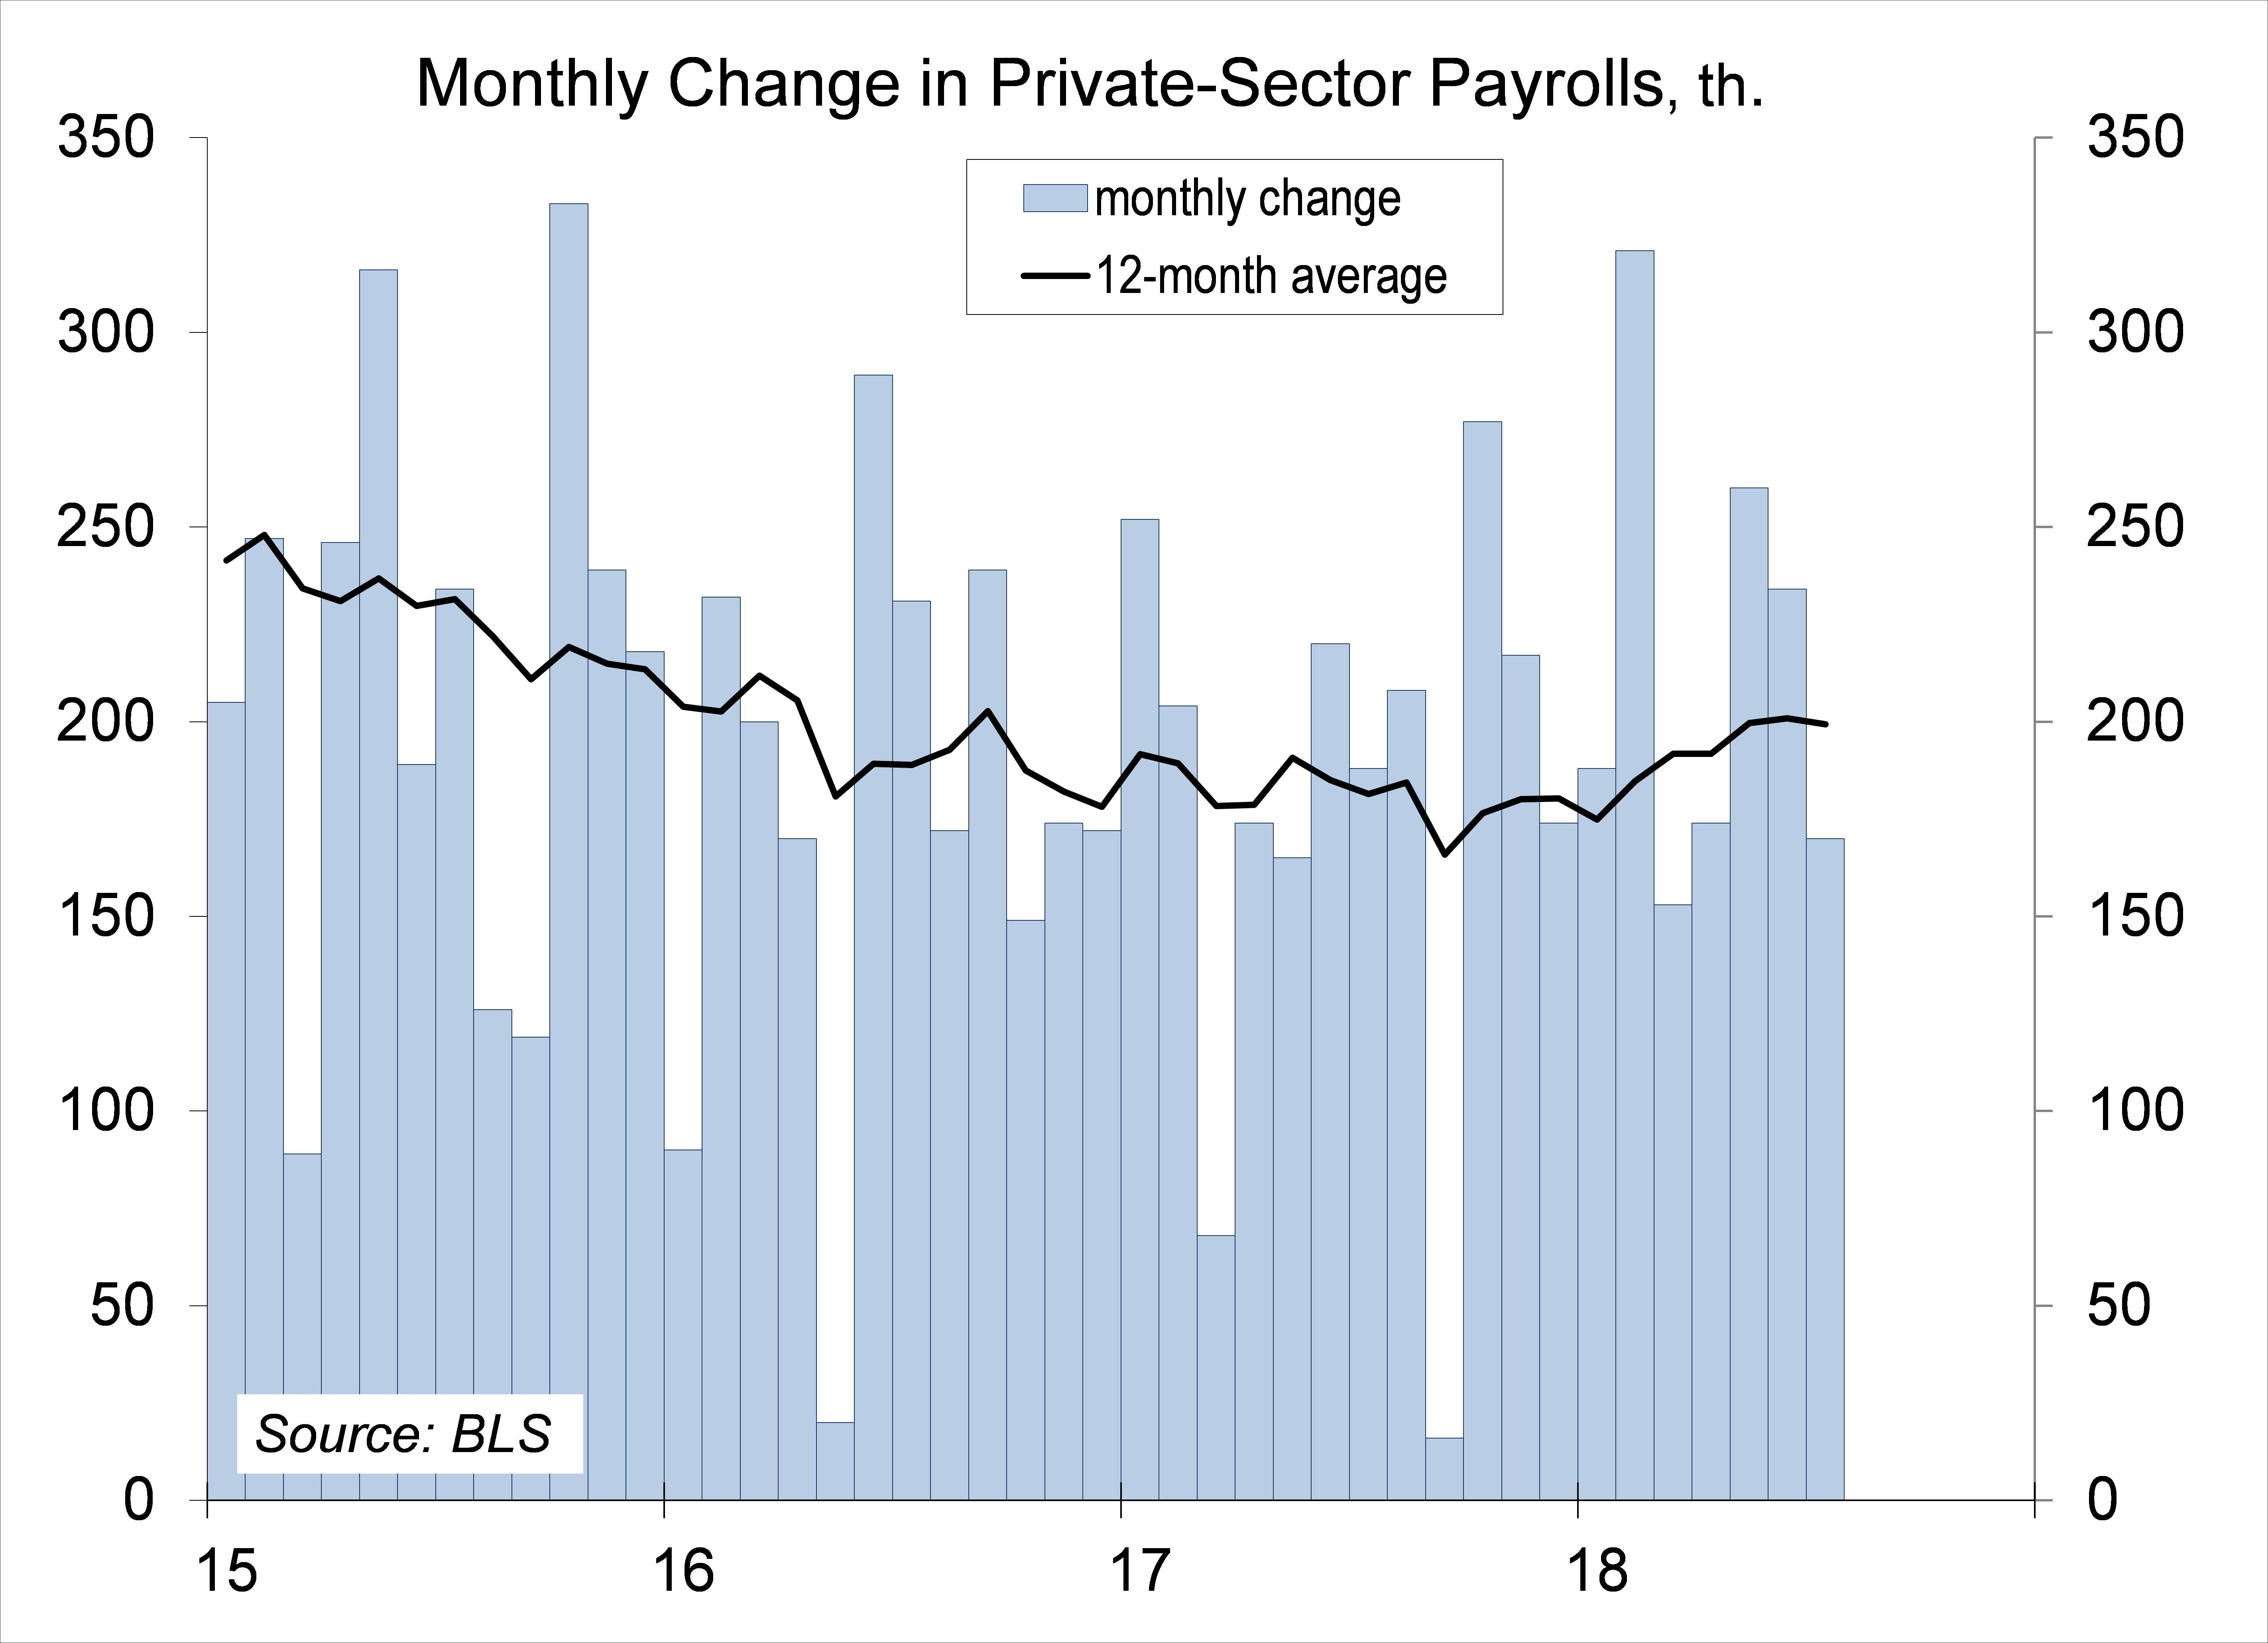
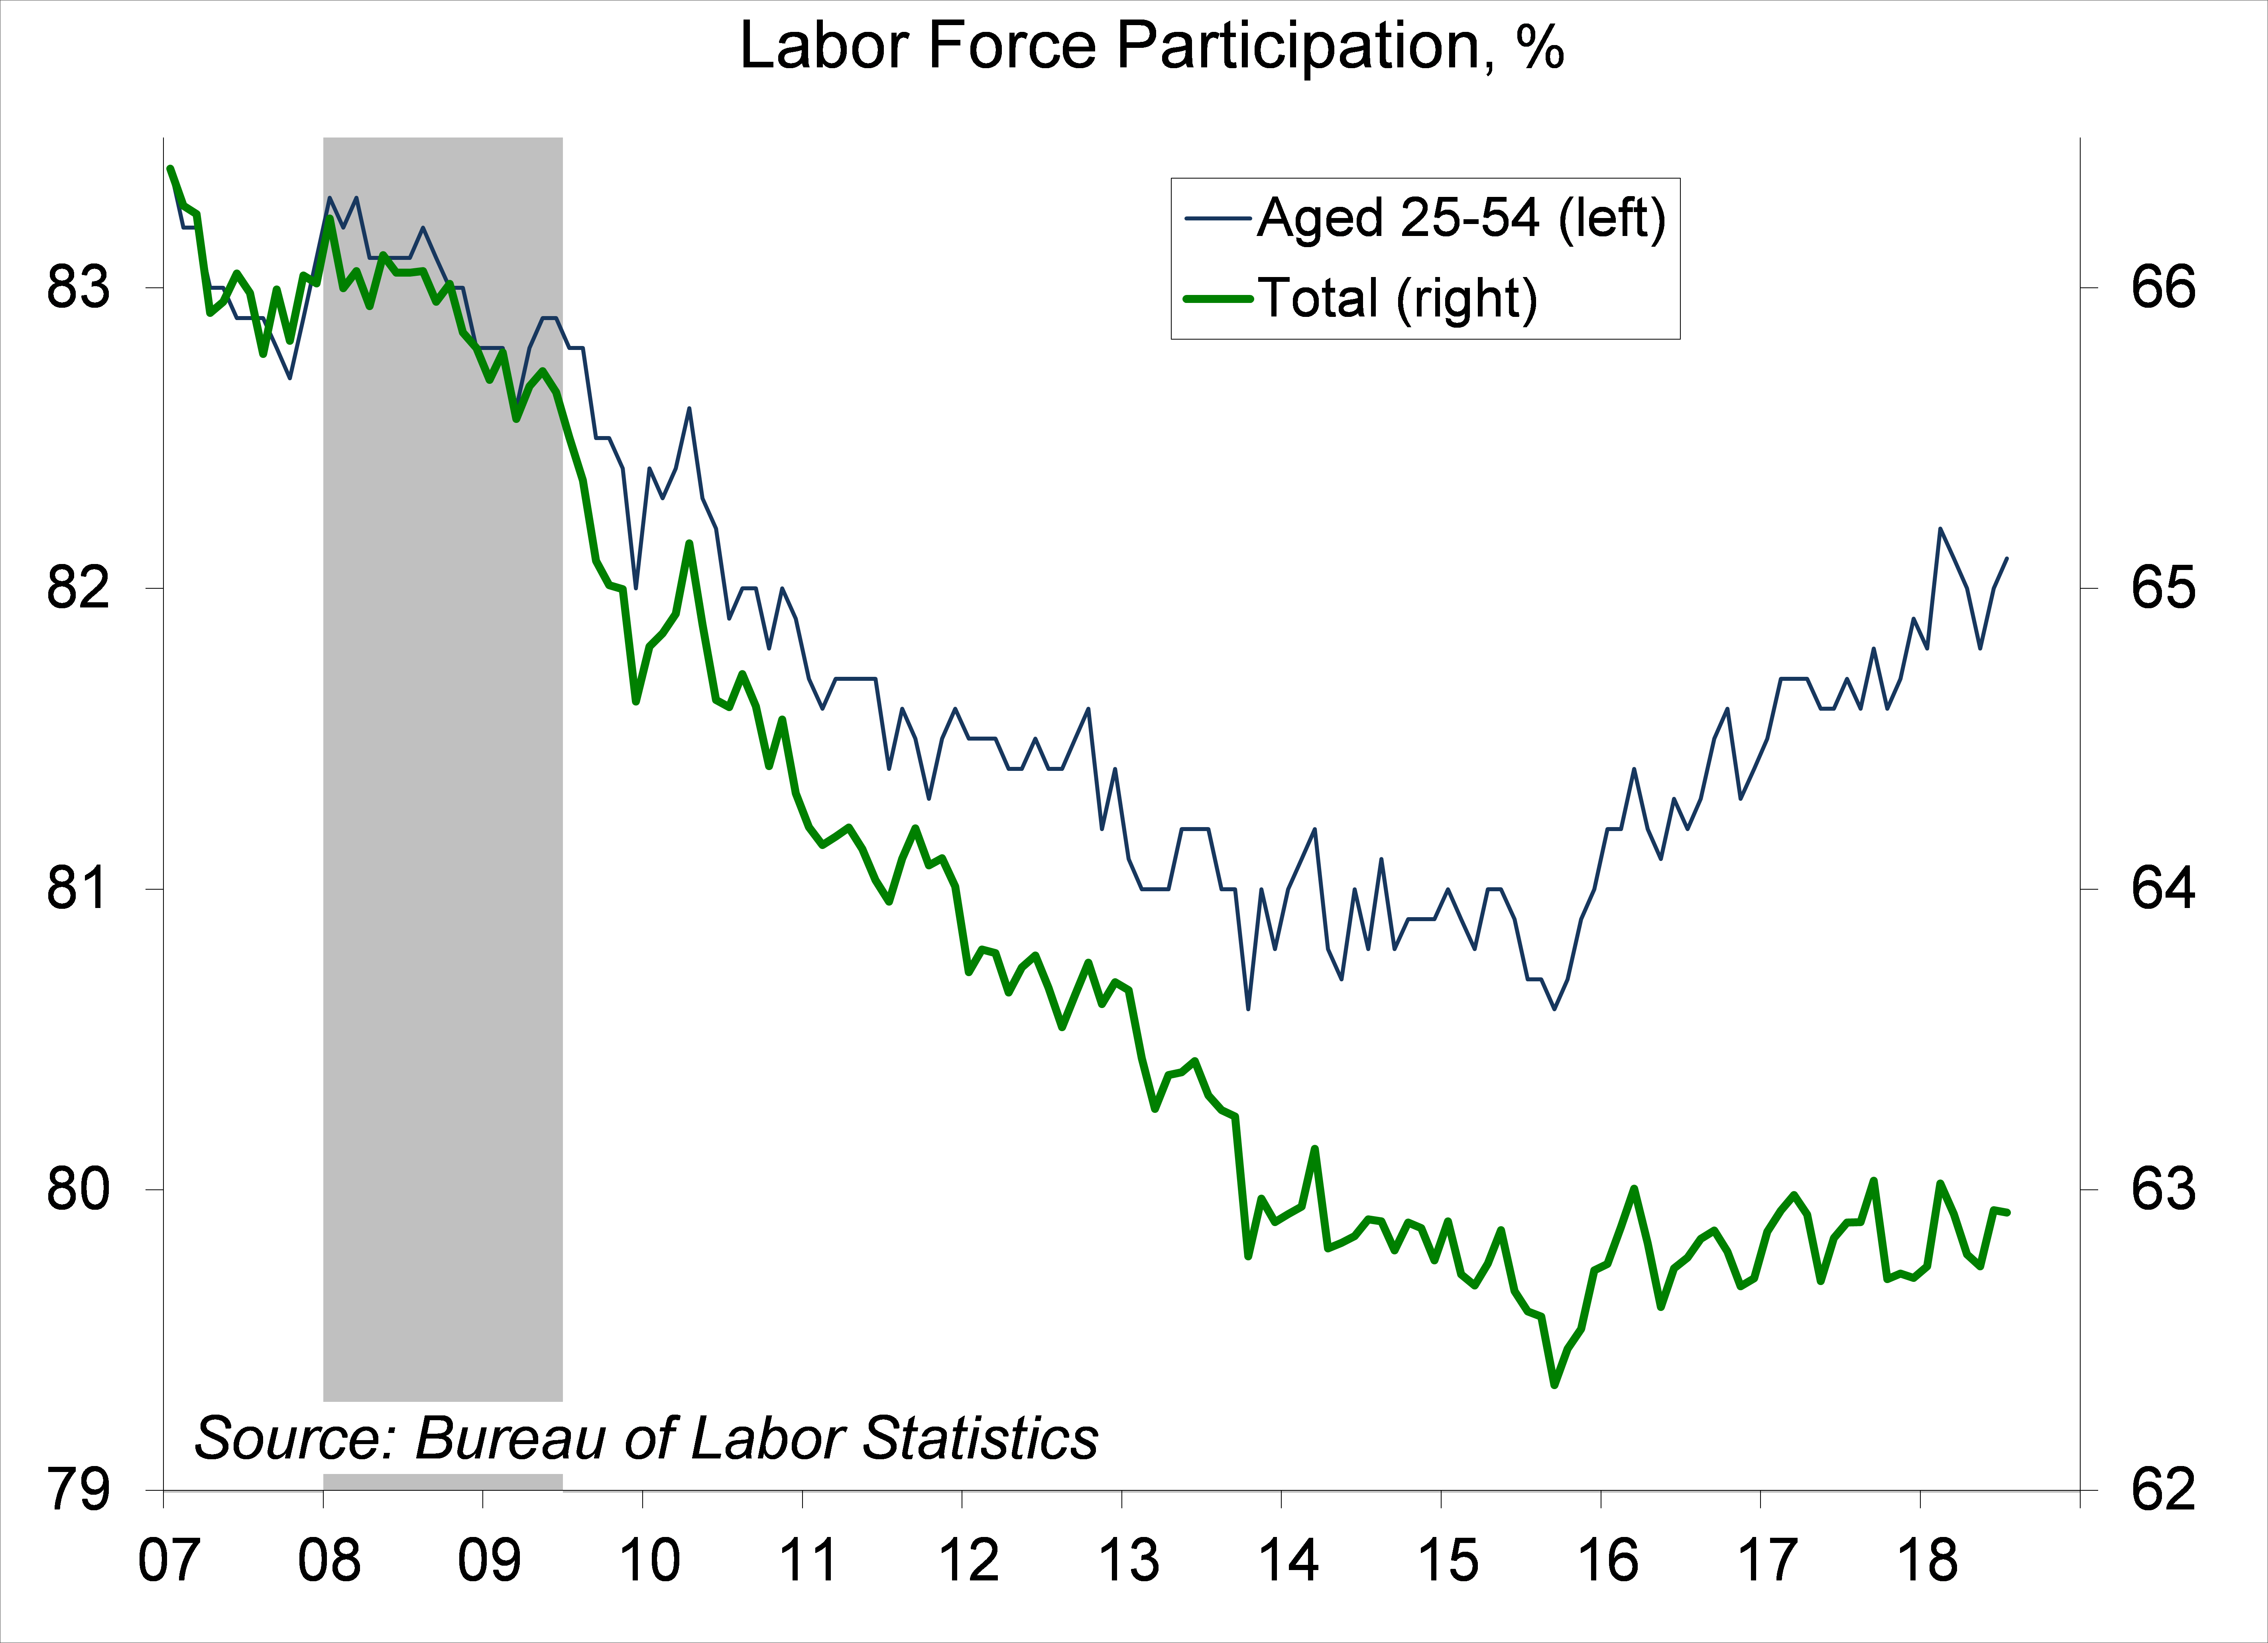
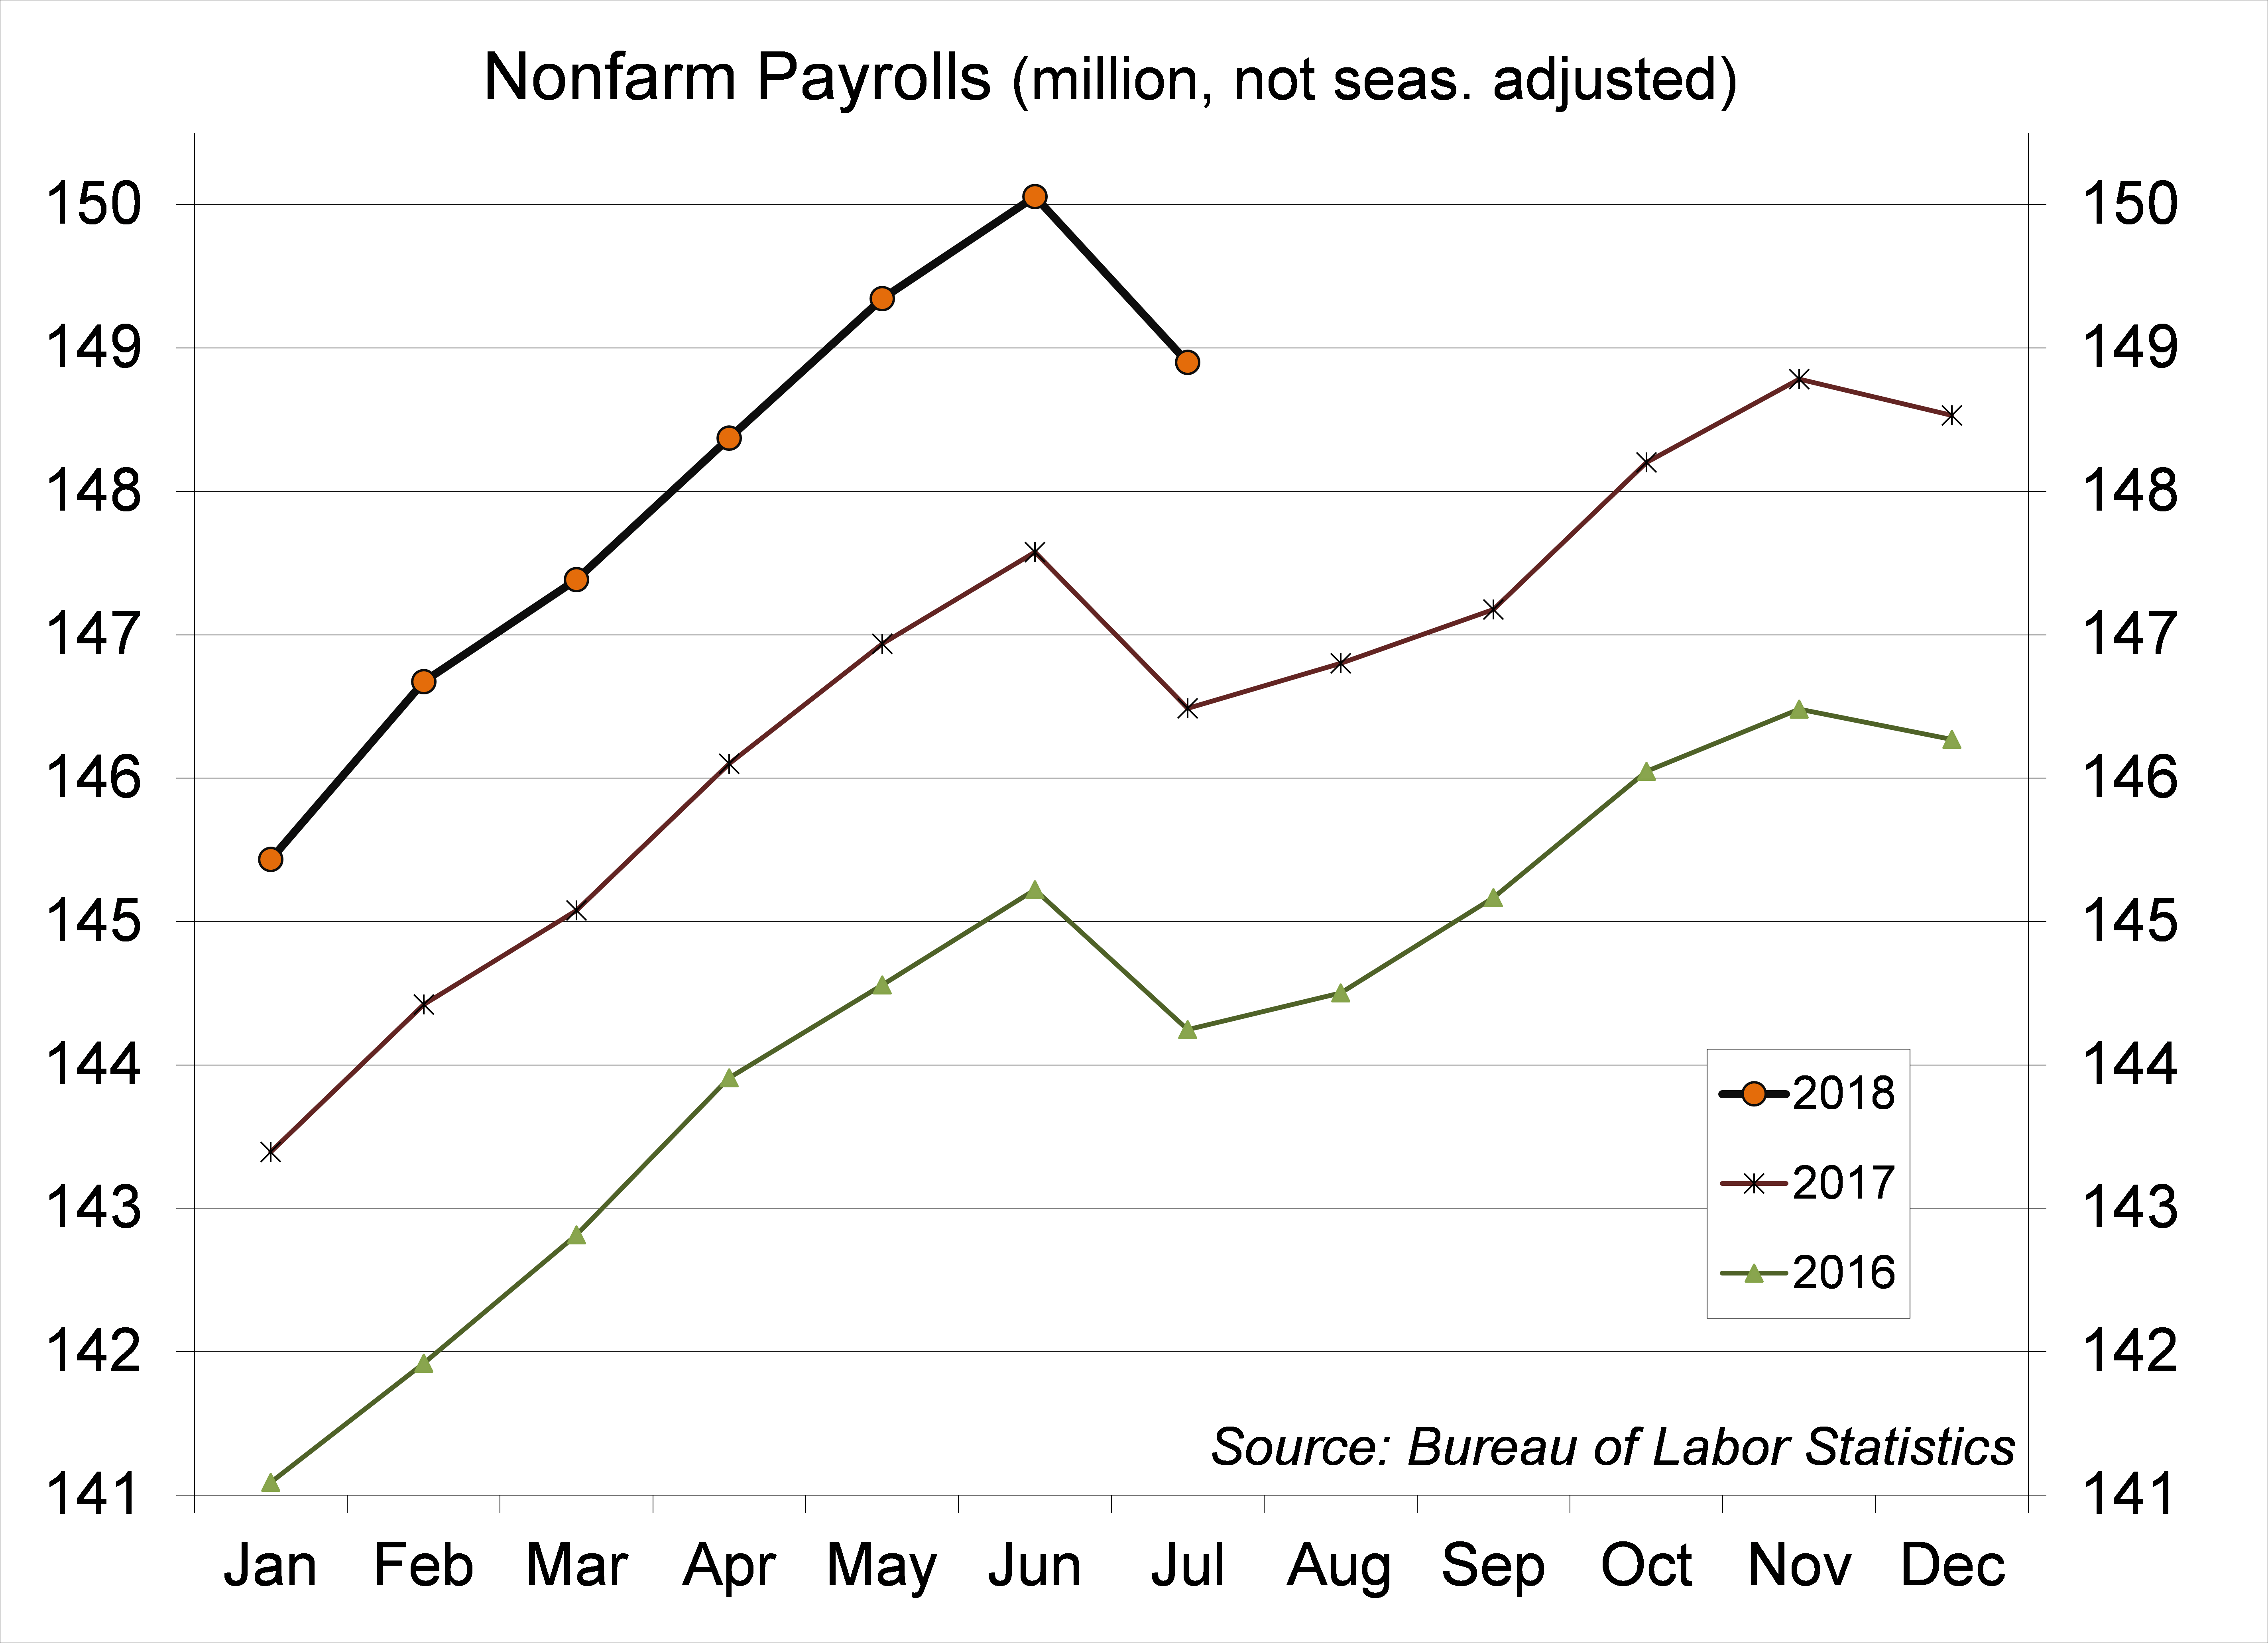
There’s a fair amount of noise in the monthly payroll figures and seasonal adjustment adds more than the usual uncertainty in July. Prior to seasonal adjustment, we lost 1.156 million jobs in July (vs. 1.092 million in July 2017), reflecting the end of the school year. For the private sector, the three-month average gain was 221,000 – more than twice the pace needed to absorb new entrants into the workforce. Labor force participation is trending about flat, but that’s a sign of strength given the demographics (an aging population implies that the participation rate would trend naturally lower). Participation has been trending higher for the key age cohort (those between 25 and 54 years). While there may still be some slack in the job market, it is fading fast.
Chart 3
Chart 4
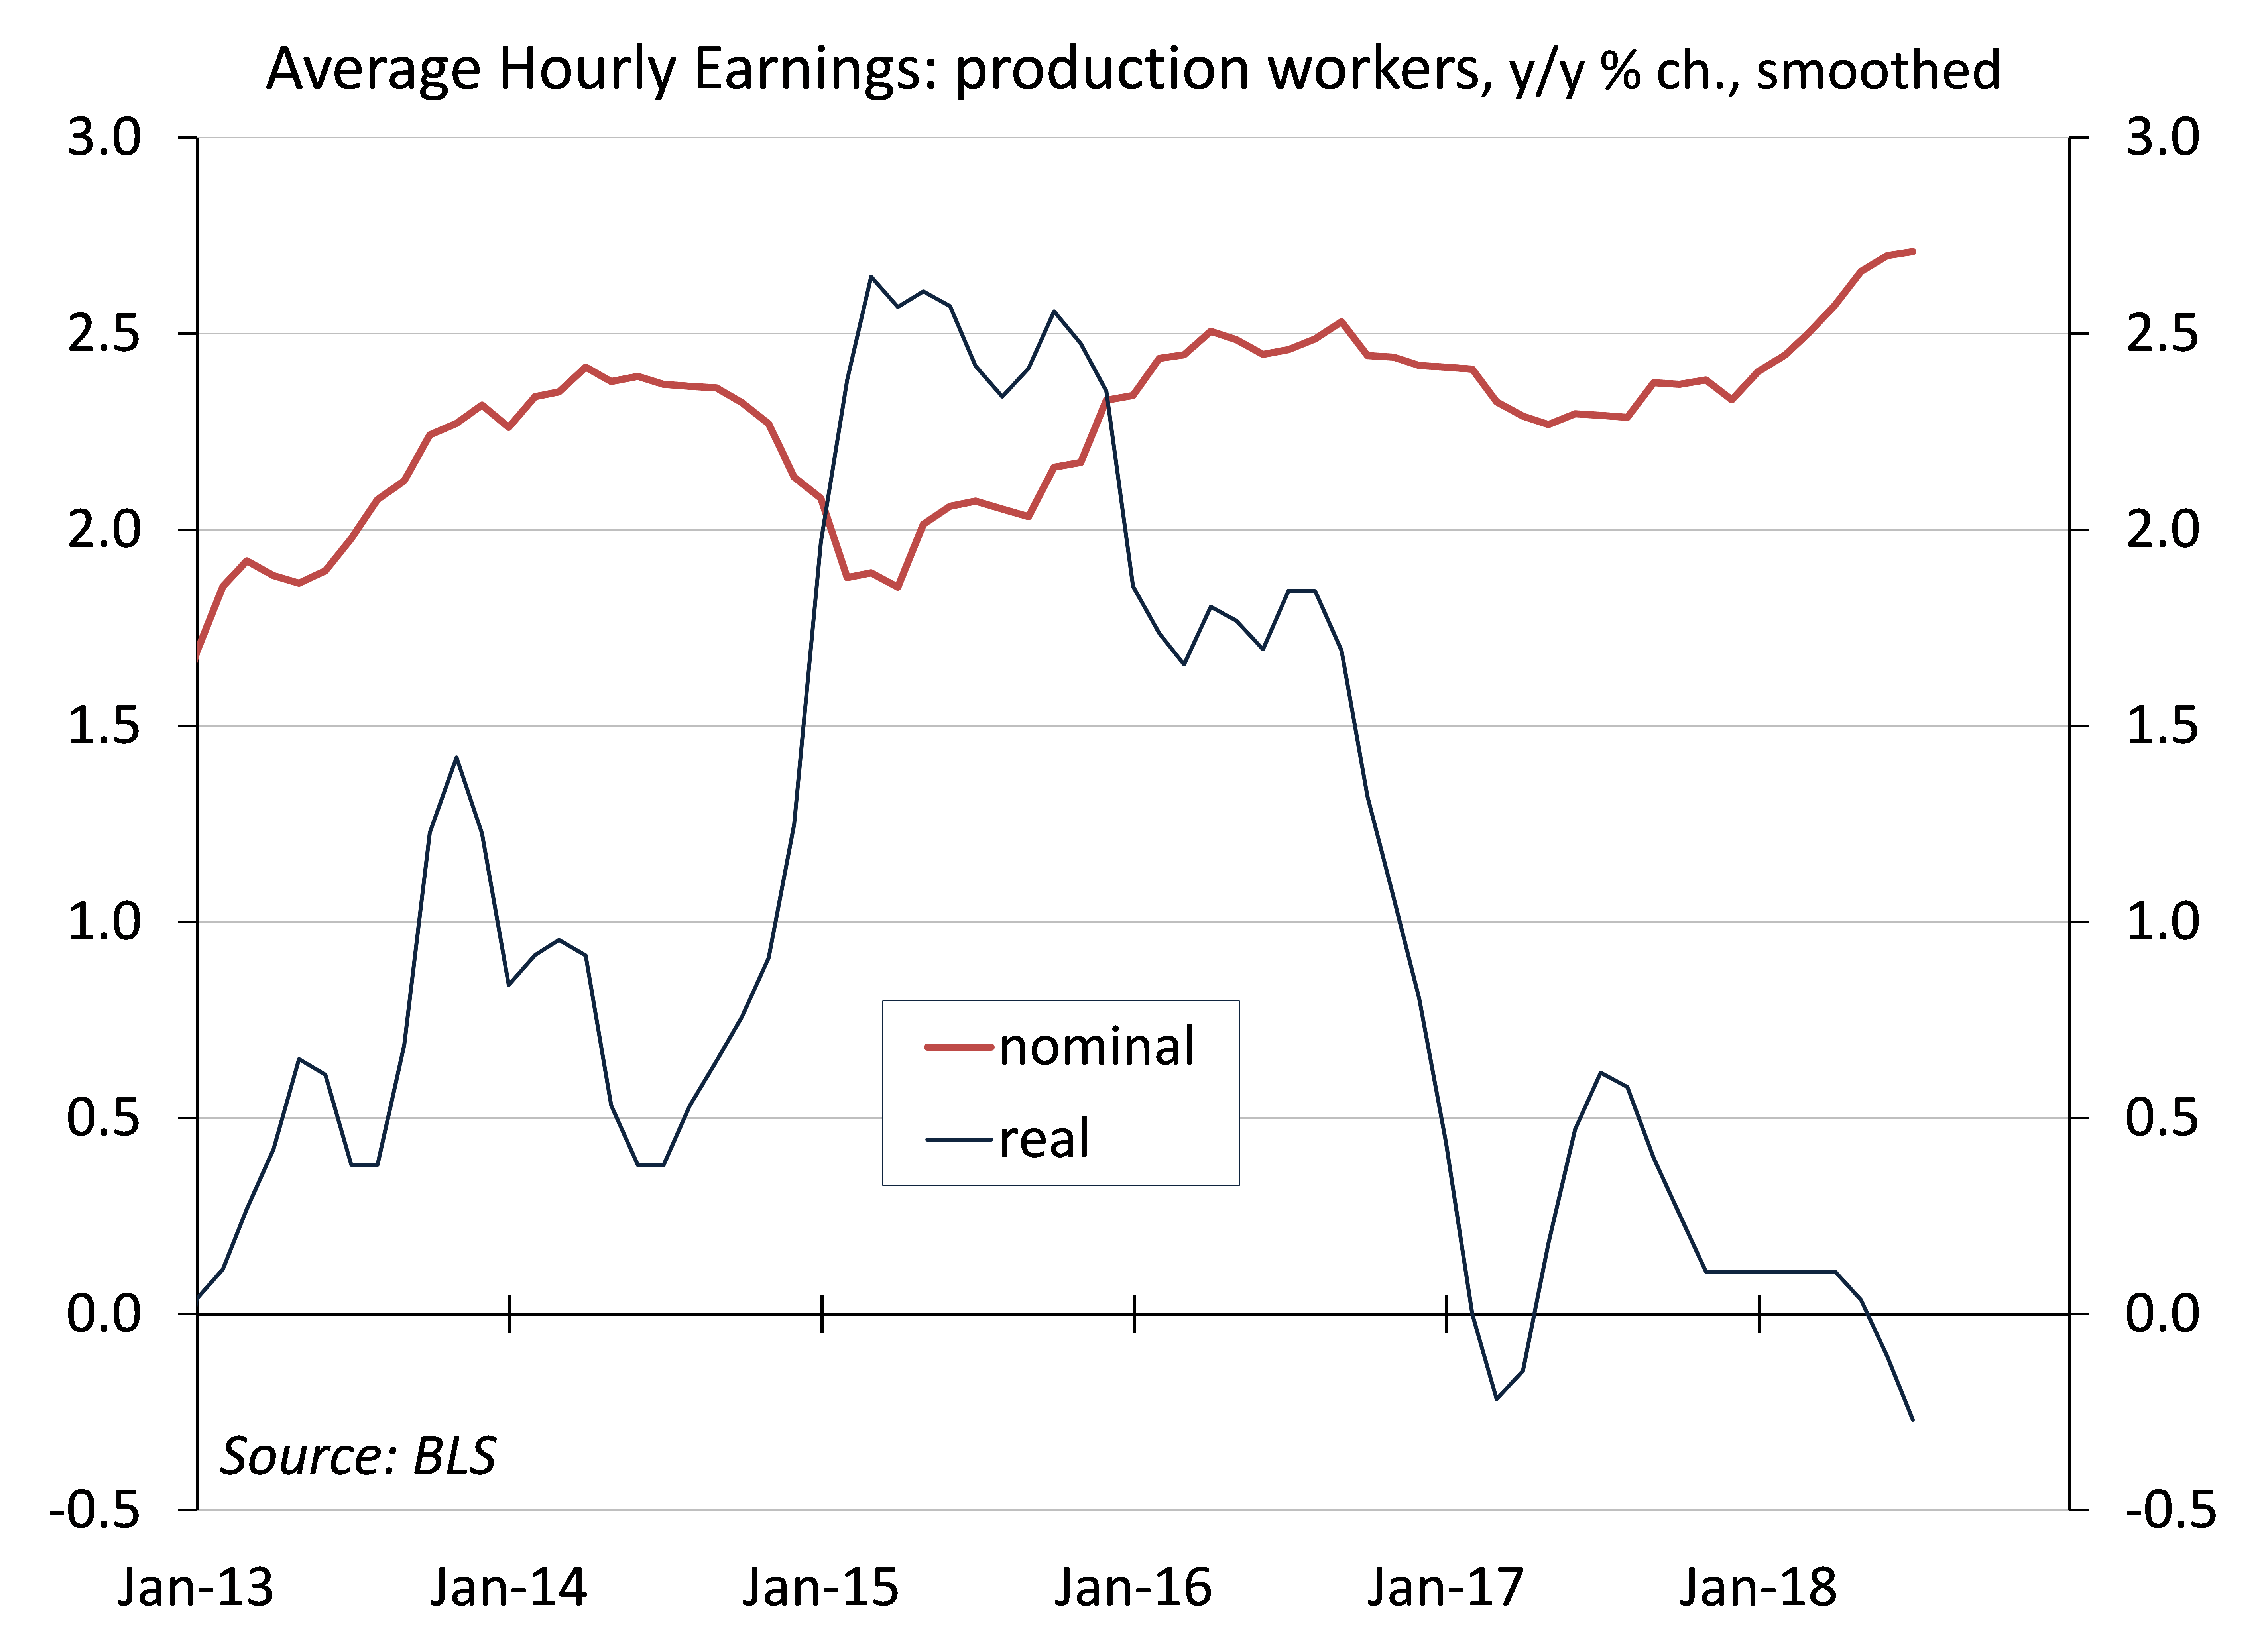
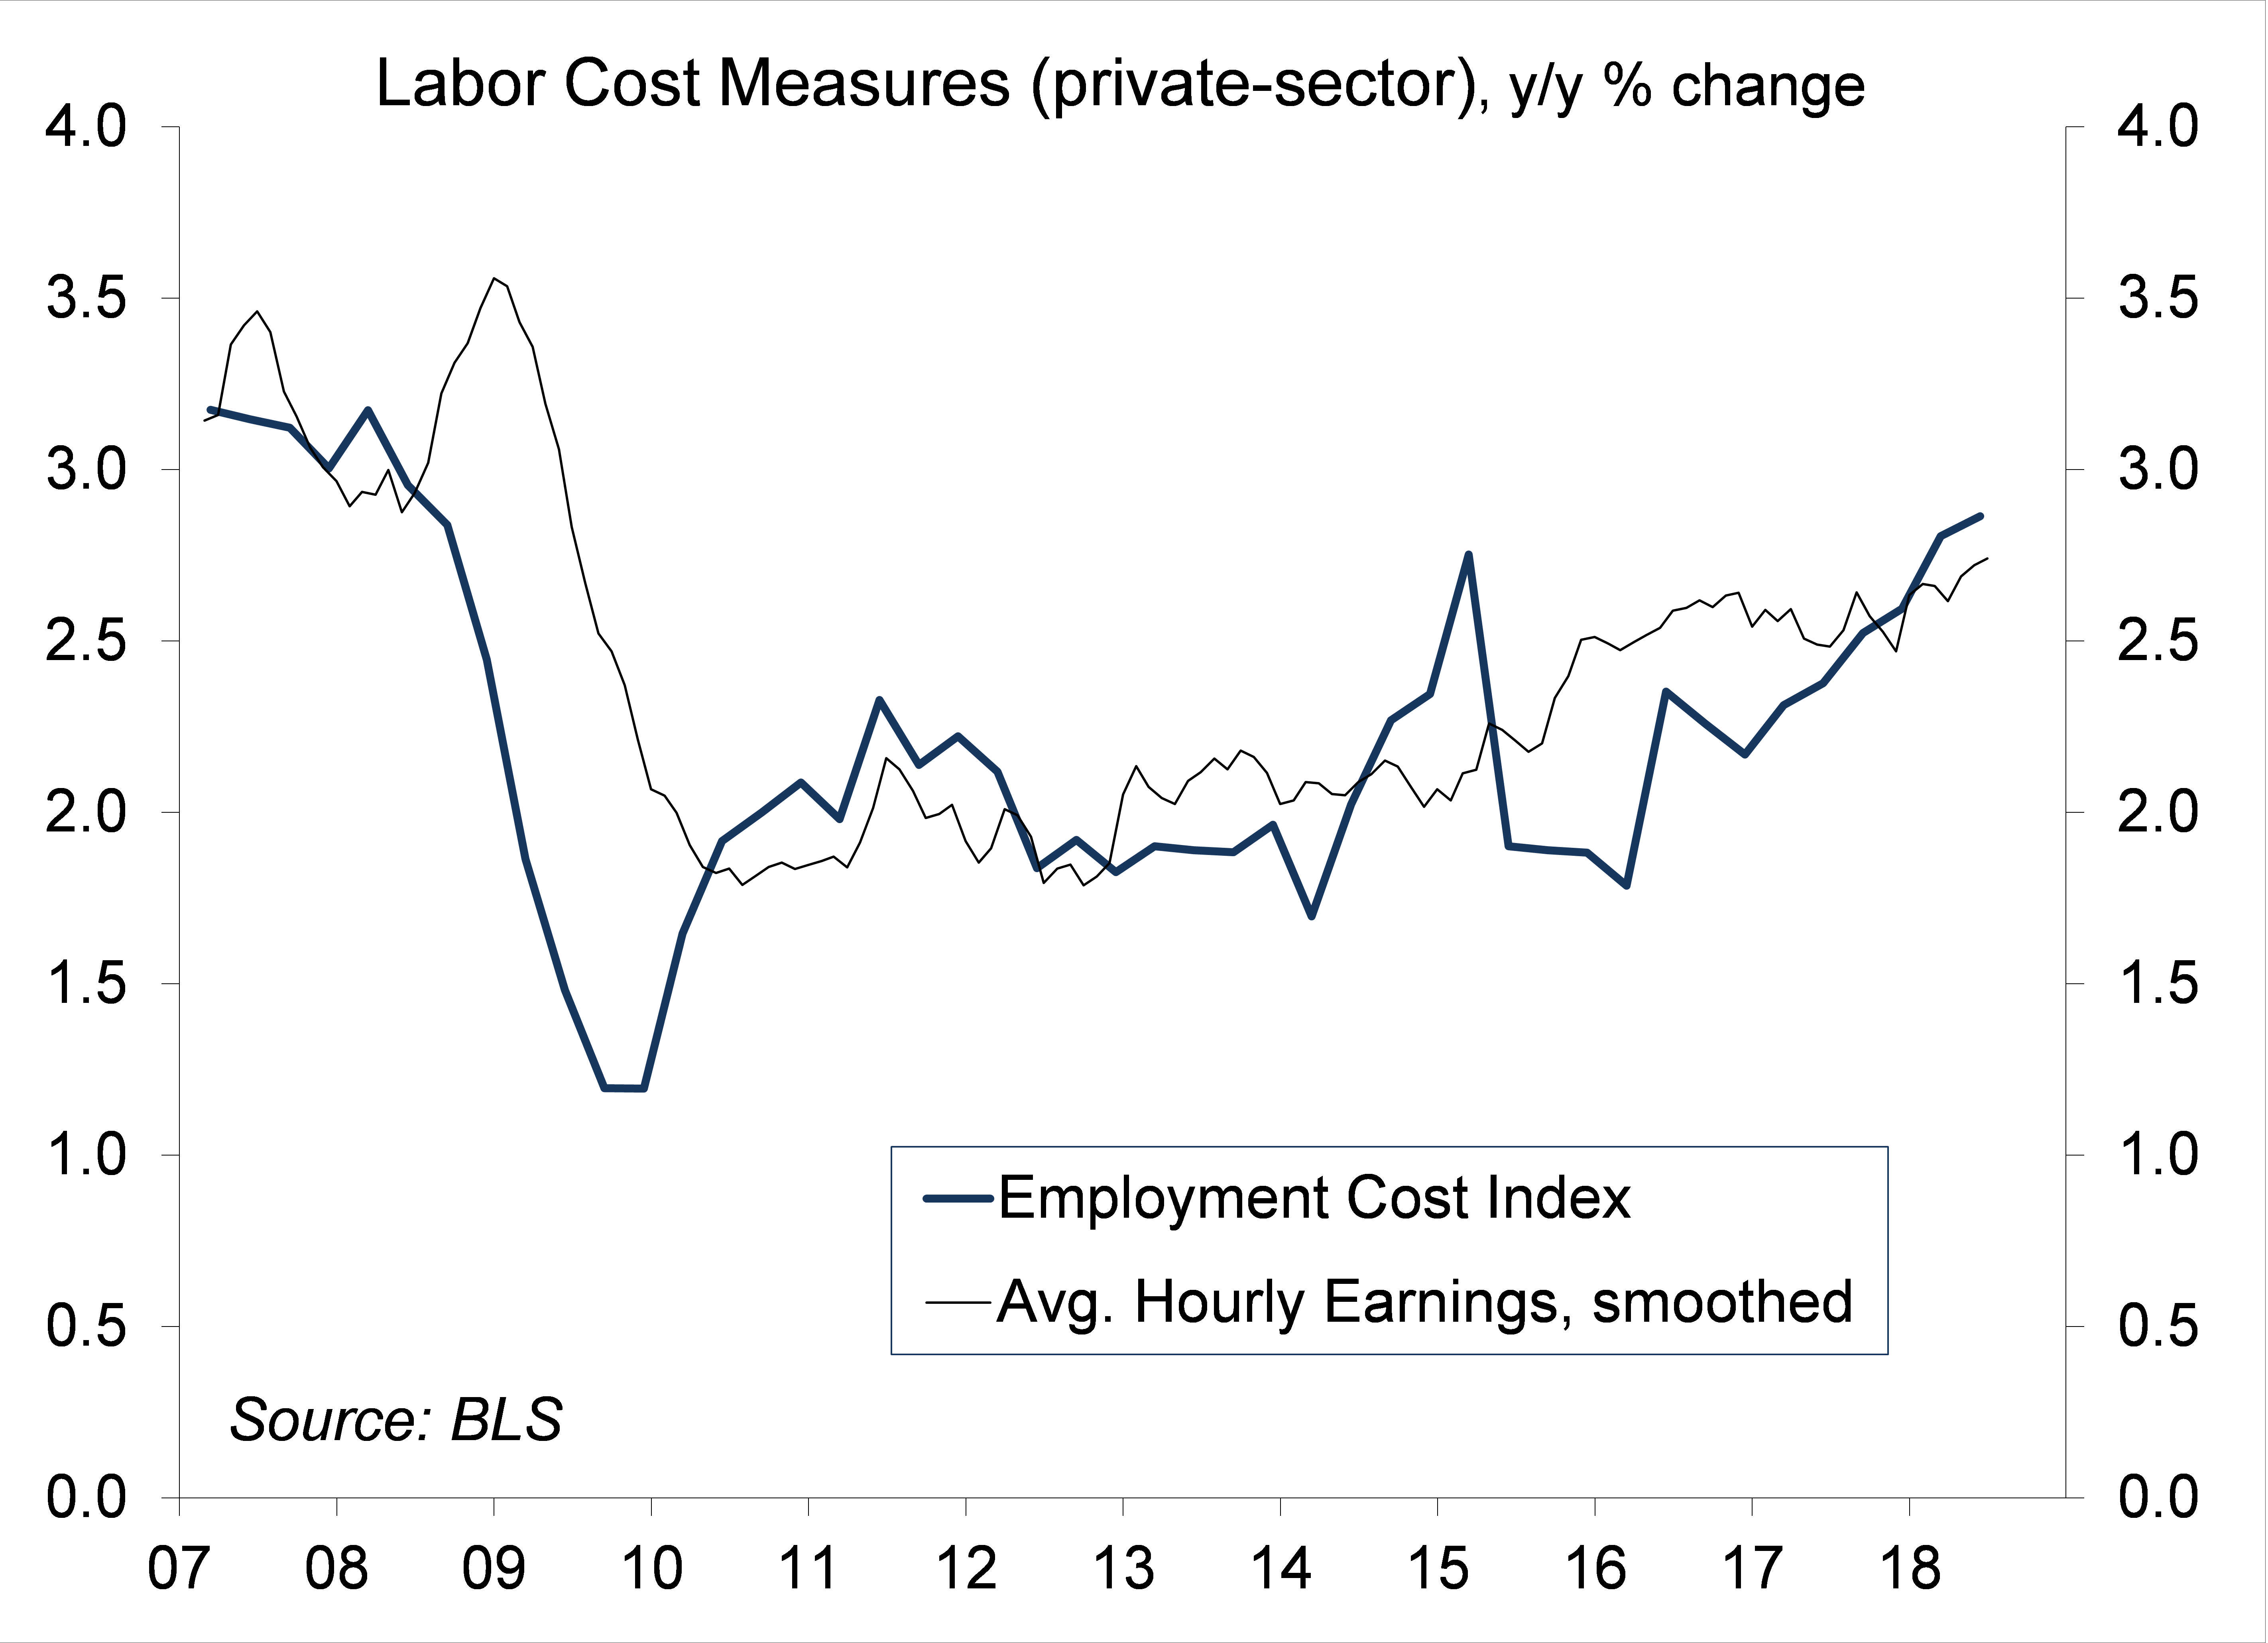
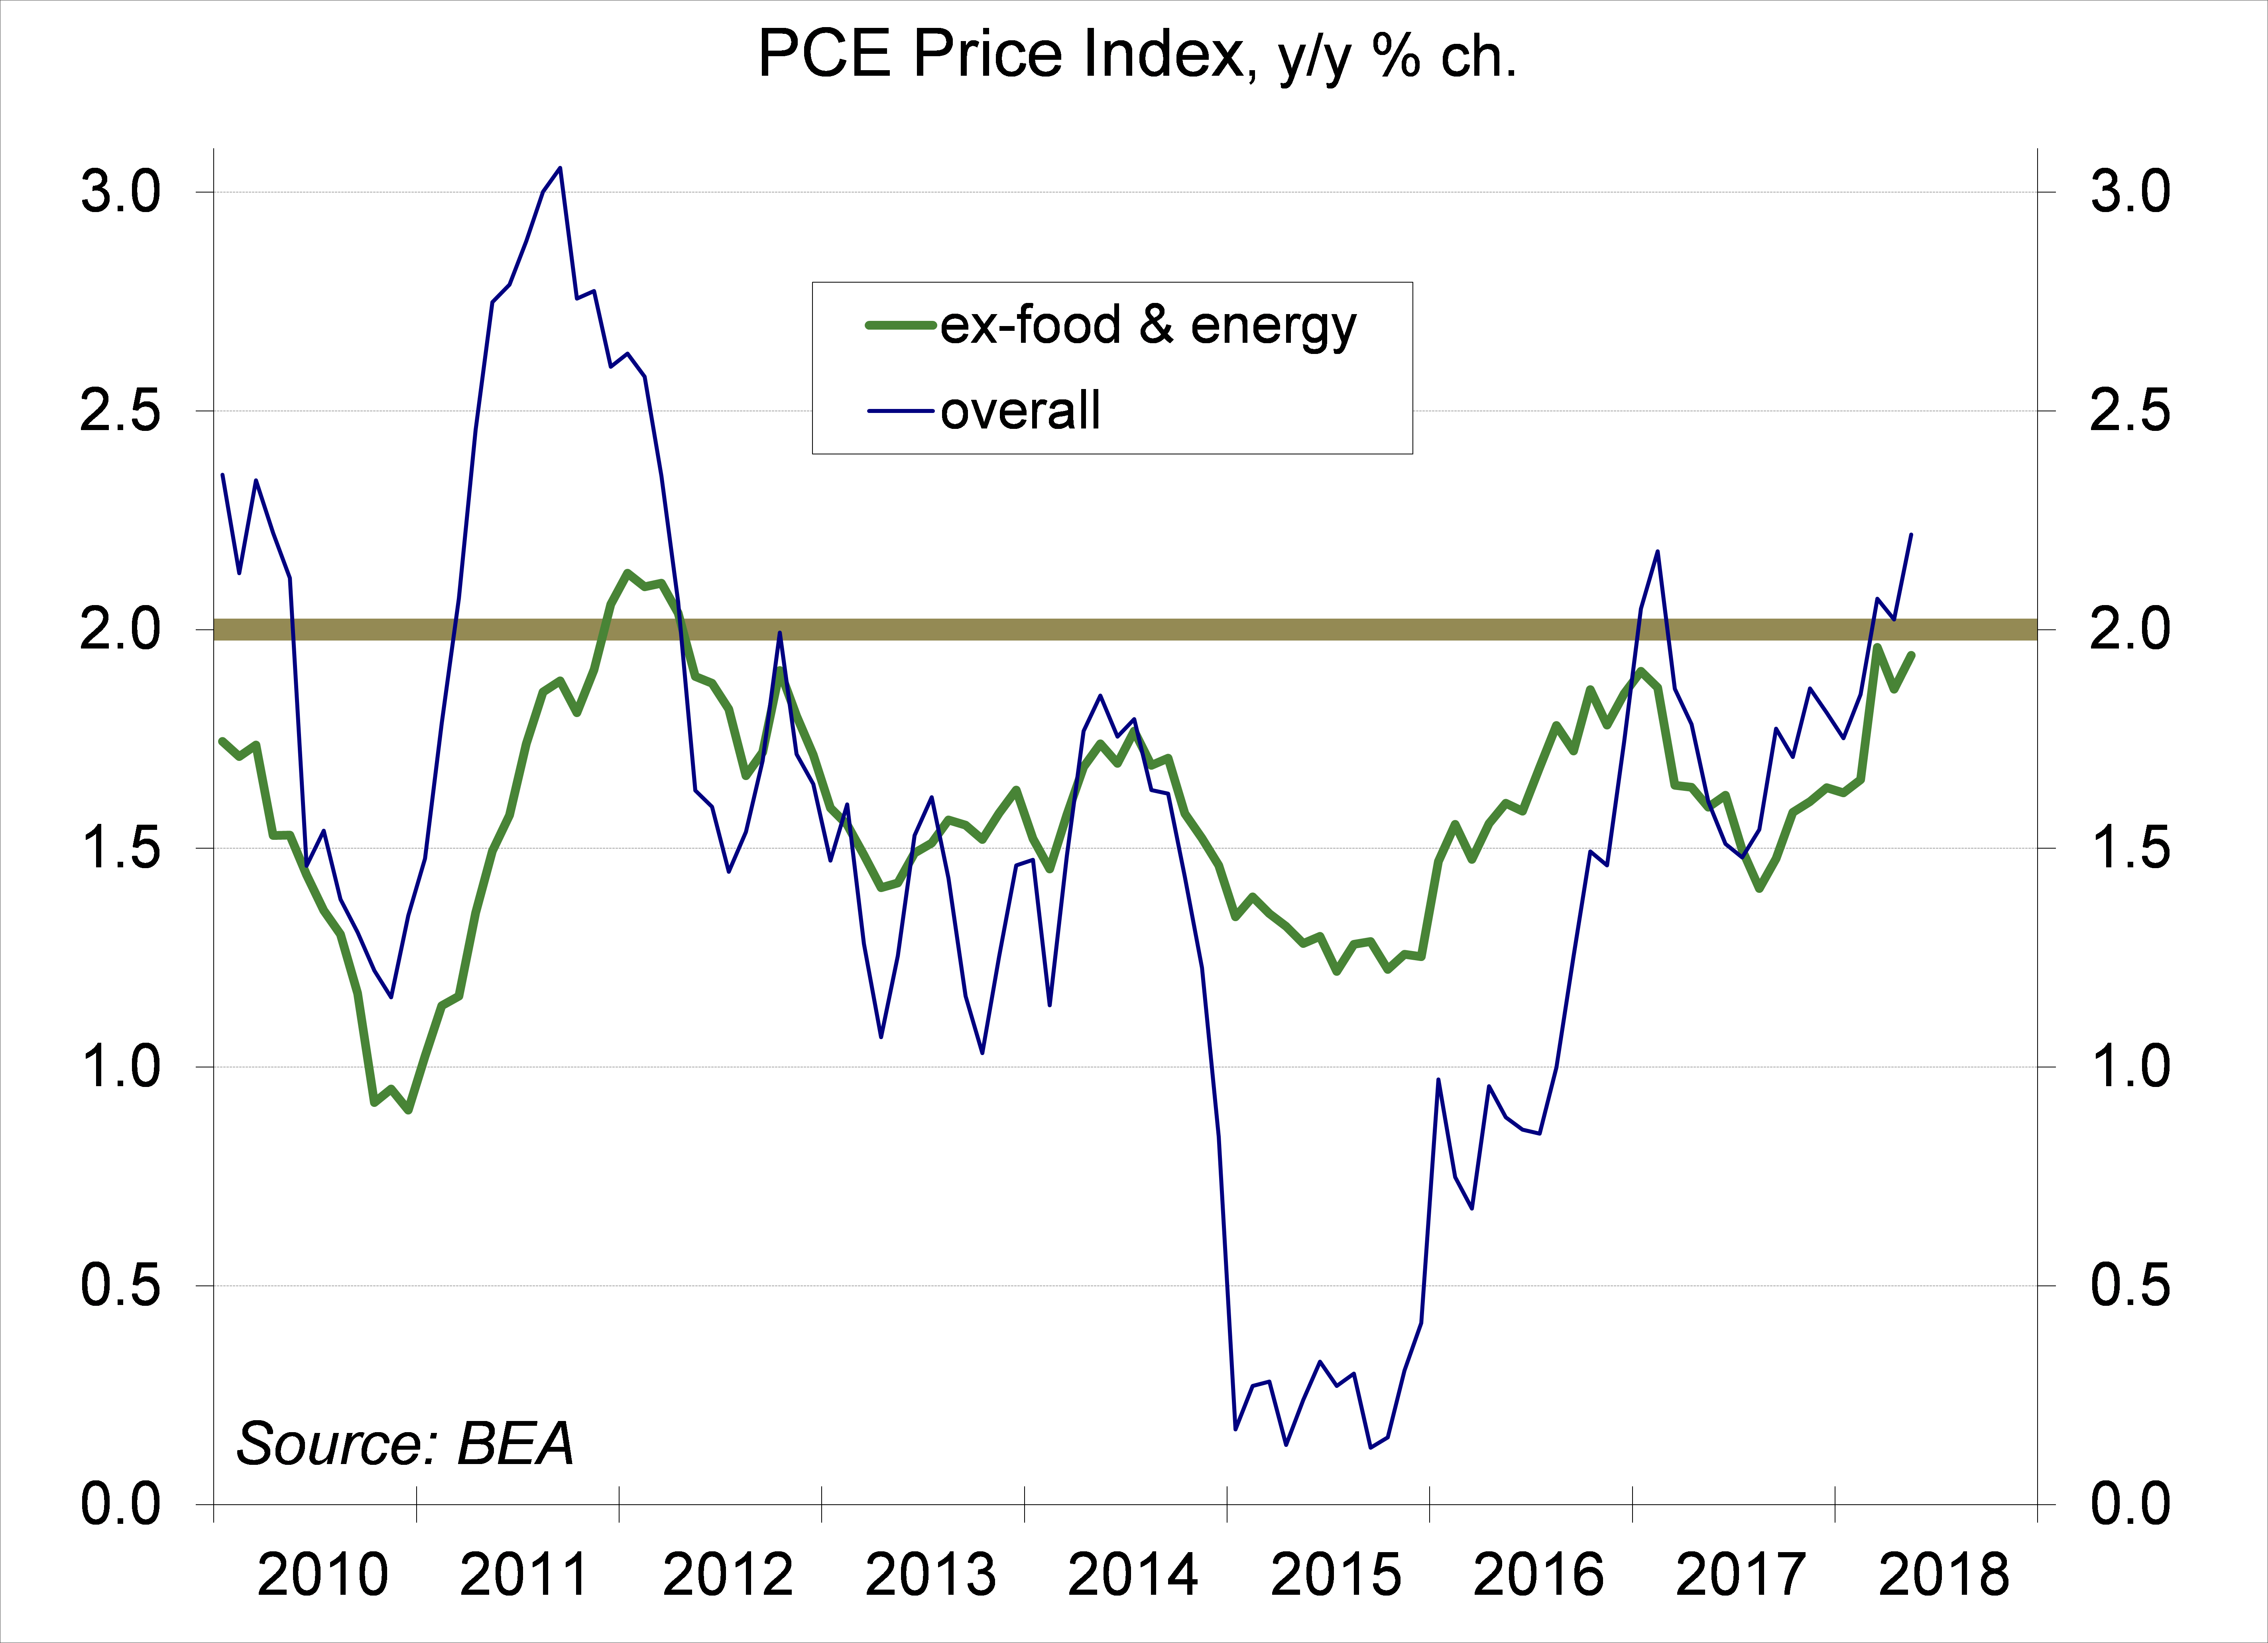
Despite the tight job market, wage growth remains moderate year-over-year, more than offset by inflation over the last 12 months. That reflects higher gasoline. Core inflation is trending lower than overall inflation. Hence, some stabilization or retreat in gasoline prices should lead to moderate growth in inflation-adjusted wages in the near term.
For the Fed, the job market data indicate that the economy is on an unsustainable long-term trajectory. However, the moderate wage growth figures suggest that the central bank can be gradual in its policy tightening. Still, in their June projections, most Fed officials saw the unemployment rate eventually moving back up to 4.5%. That won’t happen without the economy slowing.
Data Recap – No surprises from the Fed. Nonfarm payrolls rose less than anticipated in the initial estimate for July – still strong, and May and June were revised higher (about a wash relative to expectations). Investors were encouraged by the prospect of China returning to the bargaining table, but the White House doubled down on proposed tariffs against Chinese goods.
The Federal Open Market Committee left short-term interest rates unchanged following its July 31 – August 1 policy meeting. In its policy statement, the FOMC noted that “economic activity has been rising at a strong rate” (vs. “a solid rate” in the June 13 policy statement). The FOMC repeated that it expects that “further gradual increases in the target range for the federal funds rate will be consistent with sustained expansion of economic activity, strong labor market conditions, and inflation near the committee’s symmetric 2 percent objective over the medium term,” and that “risks to the economic outlook appear roughly balanced.”
U.S. Trade Representative Robert Lighthizer stated that “this week, the president has directed that I consider increasing the proposed level of the additional duty (on $200 billion of Chinese goods) from 10 percent to 25 percent.”
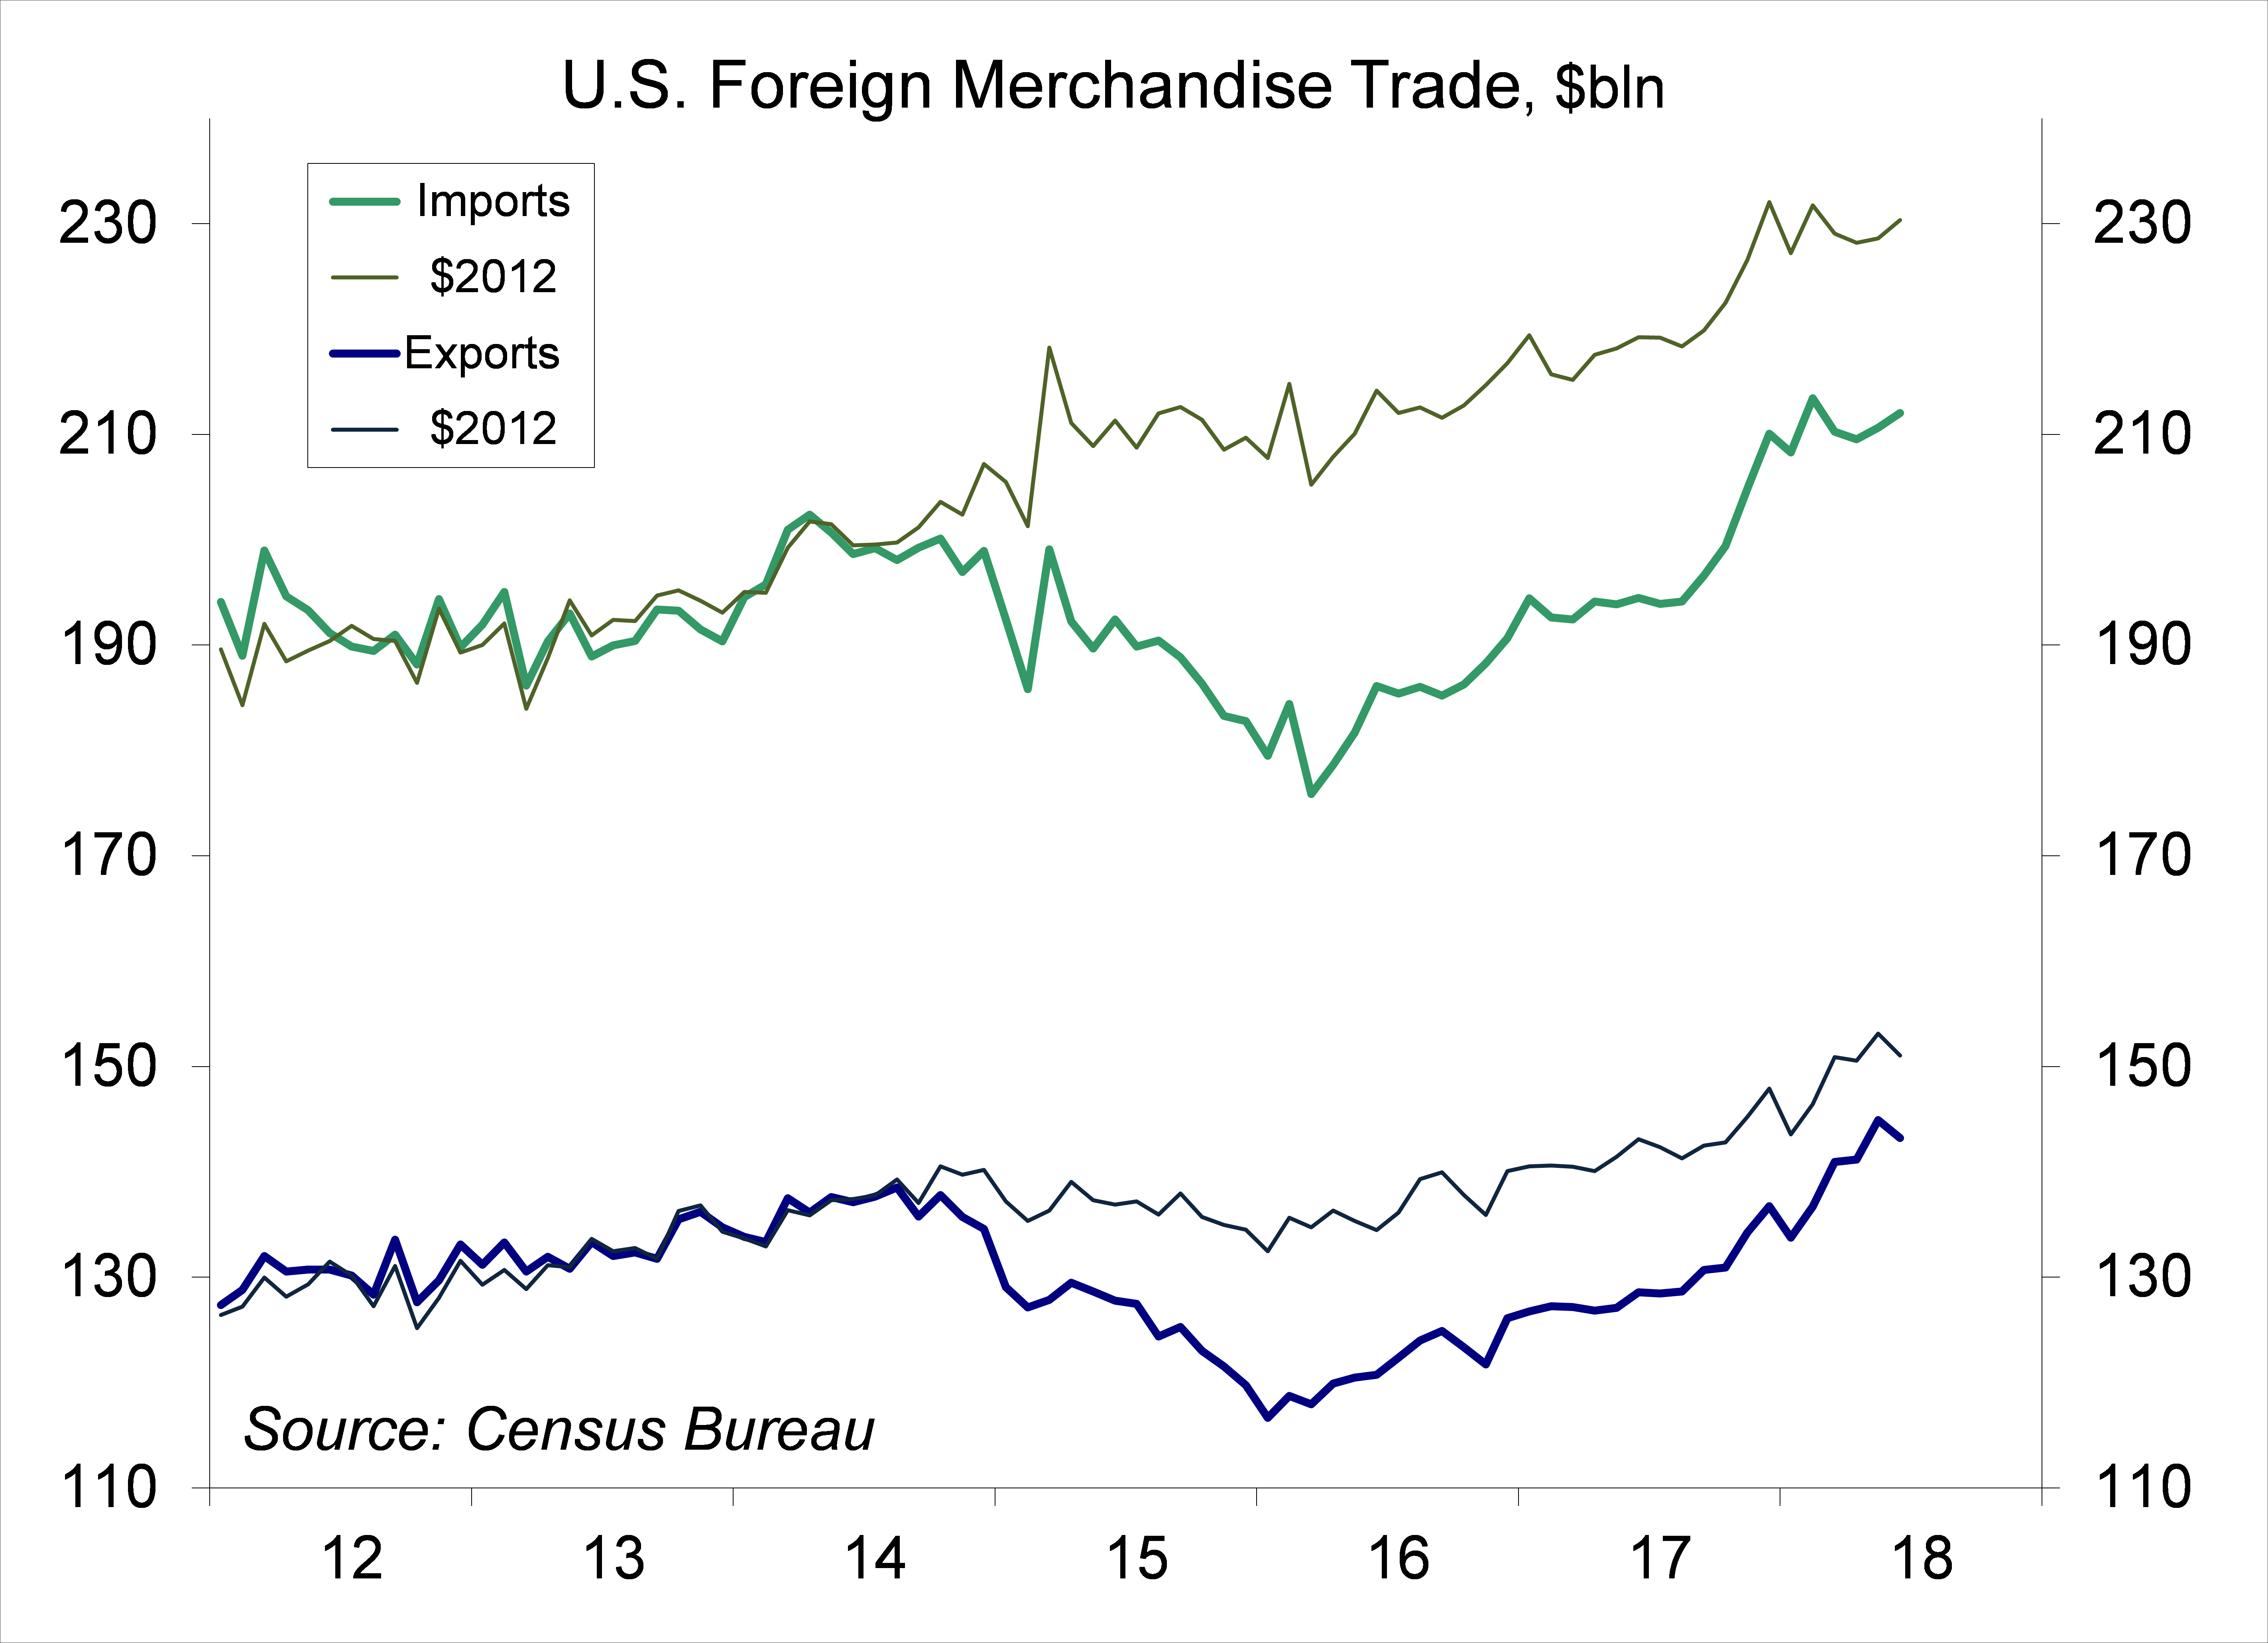
The U.S. Trade Deficit rose to $46.3 billion in June, about as expected, vs. $43.2 billion in May. Merchandise exports fell 1.2% (+11.4% y/y), while imports rose 0.7% (+9.0% y/y). The surplus in services held steady at $22.5 billion.
Chart 5
Chart 6
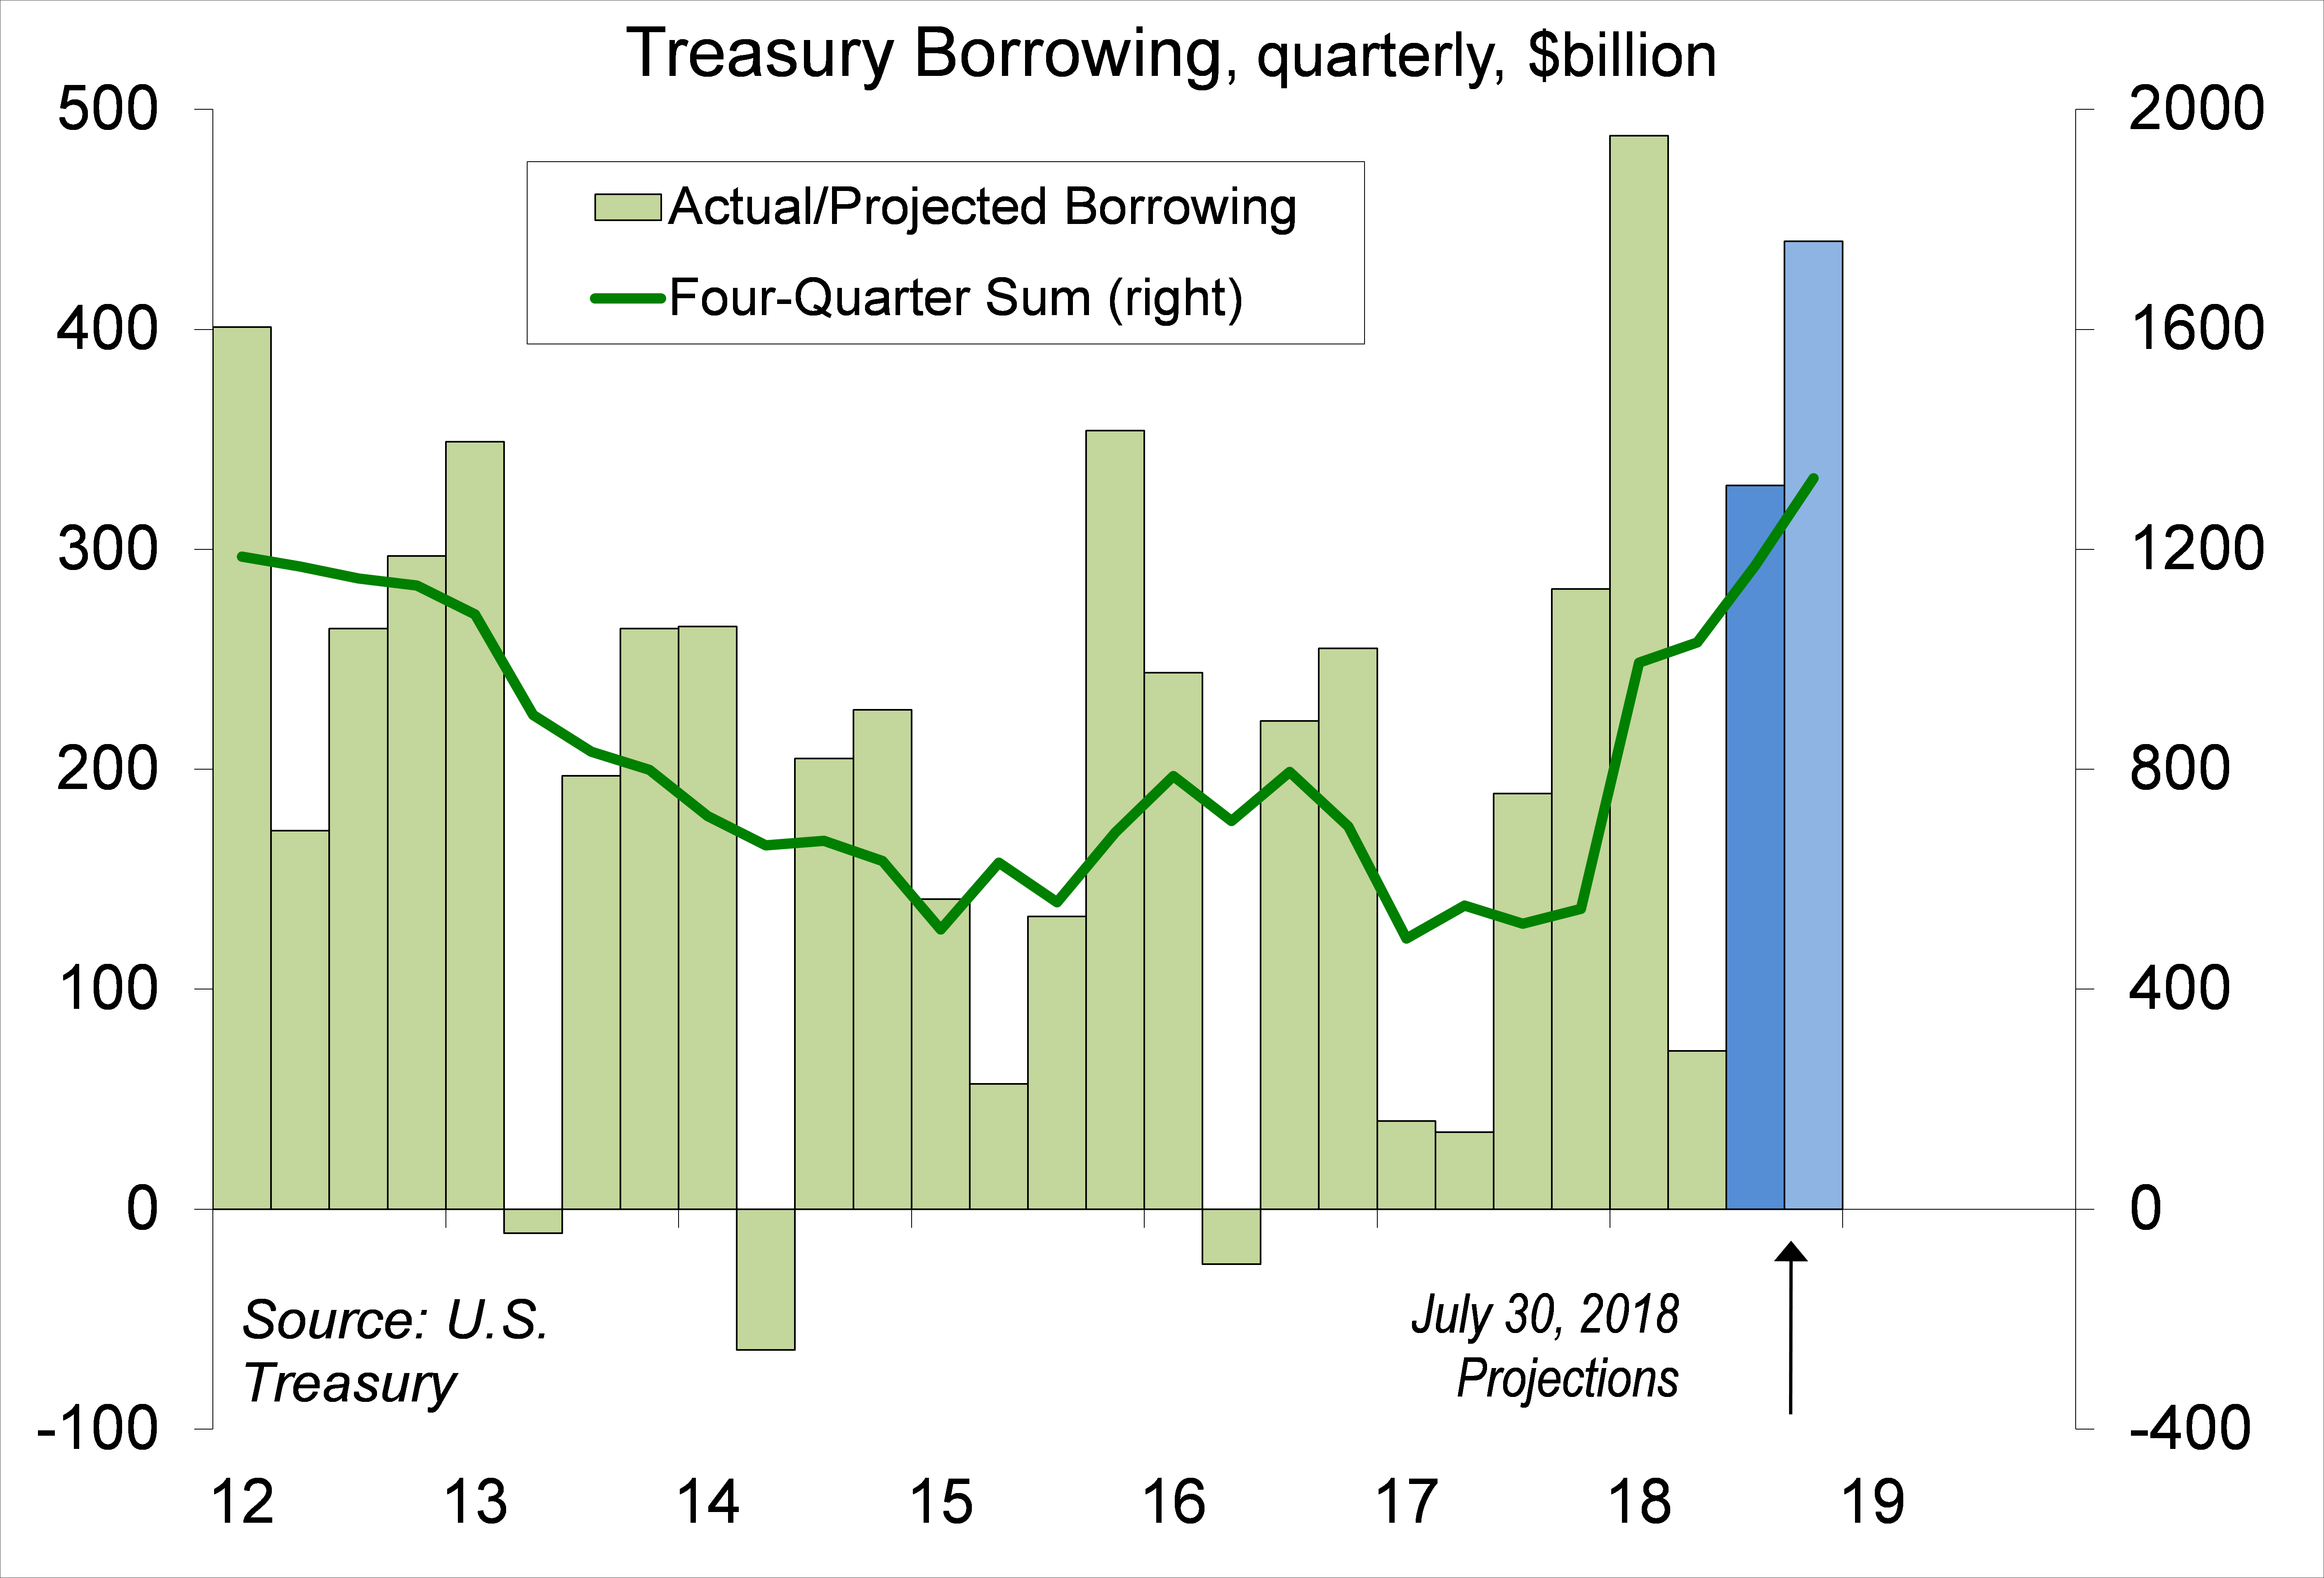
Treasury said it expects to borrow $329 billion in the Jul-Sep quarter ($56 billion higher than the April estimate) and $40 billion in the Oct-Dec quarter. Treasury said it would increase the sizes of its monthly auctions.
The July Employment Report was mixed. Nonfarm payrolls rose by 157,000 in the initial estimate for July, less than the median forecast of 190,000, but figures for May and June were revised a net 59,000 higher. The unemployment rate edged down to 3.9% (vs. 4.0% in June and 3.8% in May). Average Hourly Earnings rose 0.3% (three-month average at +2.7% y/y).
Chart 7
Chart 8
The Employment Cost Index rose 0.6% over the three months ending in June (+2.8% y/y). Wages and Salaries rose 0.5% (+2.8% y/y), while benefit costs rose 0.9% (+2.9% y/y). For private industry, the ECI rose 0.6% (+2.9% y/y).
Motor Vehicle Sales fell to a 16.7 million seasonally adjusted annual rate in July, vs. 17.2 million in June. Sales of domestically built vehicles, which count toward consumer spending, slipped to a 12.9 million pace, vs. 13.1 million in June. Sales of imported vehicles (imports have a negative sign in the GDP calculation) fell to a 3.8 million pace, vs. 4.1 million in June.
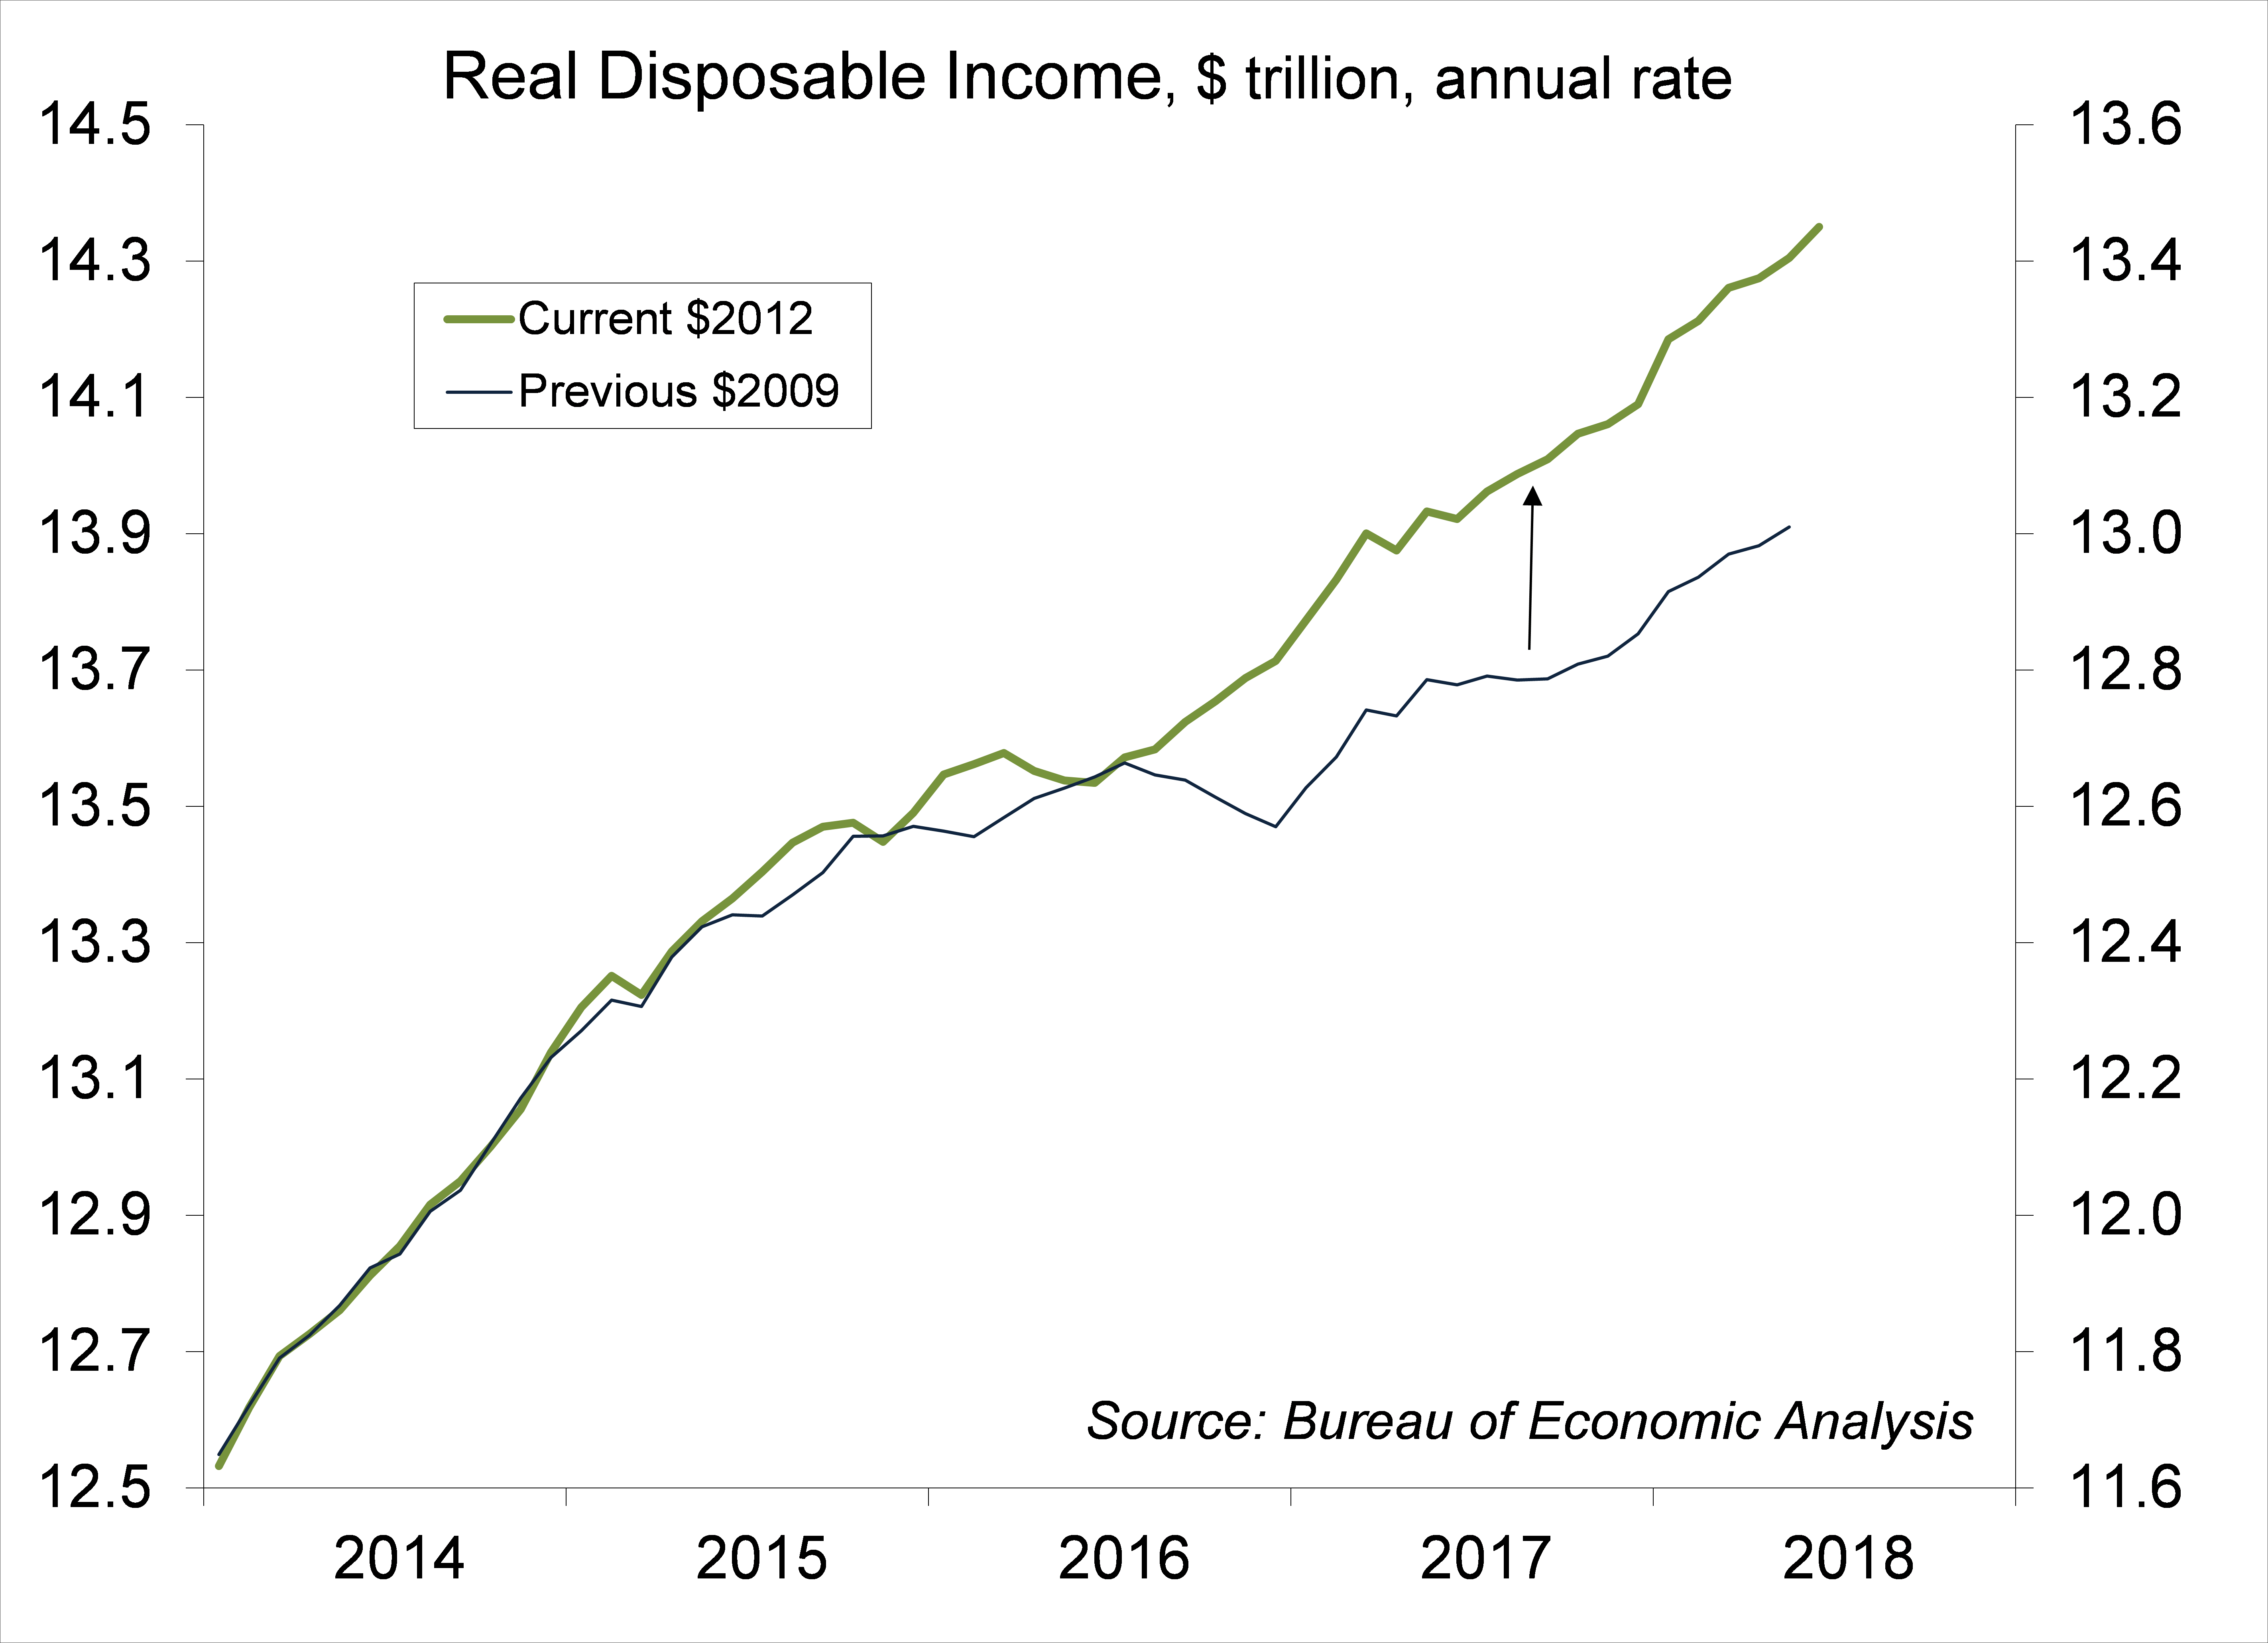
Personal Income rose 0.4% (as expected) in the initial estimate for June (+4.9% y/y). Private-sector wages and salaries rose 0.4% (+5.3% y/y). Comprehensive benchmark revisions boosted the level of income for the last couple of years, but had a limited impact on spending figures. Estimates of the savings rate (a really lousy economic statistic) rose sharply (May 2018 went from 3.2% to 6.8%). Personal Spending rose 0.4% (also as expected) in June (+5.1%), up 0.3% adjusting for inflation (+2.8% y/y). The PCE Price Index rose 0.1% (+2.2% y/y), up 0.1% ex-food & energy (+1.9% y/y, vs. the Fed’s goal of 2%).
Chart 9
Chart 10
The Conference Board Consumer Confidence Index was essentially unchanged at 127.4 in the advance estimate for July (based on information collected on or before July 19), vs. 127.1 in June (revised from 126.4). Evaluations of current conditions improved, partly reflecting greater optimism about current job availability. However, expectations fell for the second consecutive month.
Factory Orders rose 0.7% in June (+6.1% y/y). Durable goods orders were revised to +0.8% (vs. +1.0% in the advance estimate). Orders for nondurables rose 0.5%. Results were mixed across industries. Orders for nondefense capital goods ex-aircraft rose 0.2% (vs. +0.6% in the advance estimate) – a +10.2% annual rate in 2Q18 (vs. +1.5% in 1Q18 and +3.5% in 4Q17). Shipments (for this category) rose 0.7% (revised from +1.0%) – a 3.8% annual rate in 2Q18 (vs. +2.9% in 1Q18, +11.3% in 4Q17).
The ISM Manufacturing Index edged down to 58.1 in July, vs. 60.2 in June and 58.7 in May. Growth in new orders and production were strong, but a bit slower than in June. Job growth was moderately strong. Input price pressures remained elevated. Comments from supply managers were upbeat, but showed continued concerns about tariffs, labor shortages, and capacity constraints.
The Chicago Business Barometer rose to 65.5 in July, vs. 64.1 in June and 62.7 in May. New orders and production reached 6-month highs. Employment improved, but there were still reports of “firms struggling to source ideal candidates, which continues to hamper recruitment plans.” Input price pressure increased (highest level since September 2008). The report noted higher prices widespread across a range of key inputs with firms attributing the rise to recently implemented tariffs on imported goods.
The ISM Non-Manufacturing Index slipped to 55.7 in July, vs. 59.1 in June and 58.6 in May. Growth in business activity and new orders slowed (still relatively strong). Employment growth picked up. Input price pressures remained elevated. Comments from supply managers were generally upbeat, but showed further concerns about tariffs, input price increases, and transportation.
The Bank of England’s Monetary Policy Committee raised the Bank Rate 25 basis points to 0.75%, citing “a very limited degree of slack” in the U.K. economy. The MPC continued to recognize that “the economic outlook could be influenced significantly by the response of households, businesses and financial markets to developments related to the process of EU withdrawal.” The MPC indicated that, if the economy evolves as anticipated, “an ongoing tightening of monetary policy over the forecast period would be appropriate.” However, future rate increases “are likely to be at a gradual pace and to a limited extent.”
The opinions offered by Dr. Brown should be considered a part of your overall decision-making process. For more information about this report – to discuss how this outlook may affect your personal situation and/or to learn how this insight may be incorporated into your investment strategy – please contact your financial advisor or use the convenient Office Locator to find our office(s) nearest you today.
All expressions of opinion reflect the judgment of the Research Department of Raymond James & Associates (RJA) at this date and are subject to change. Information has been obtained from sources considered reliable, but we do not guarantee that the foregoing report is accurate or complete. Other departments of RJA may have information which is not available to the Research Department about companies mentioned in this report. RJA or its affiliates may execute transactions in the securities mentioned in this report which may not be consistent with the report’s conclusions. RJA may perform investment banking or other services for, or solicit investment banking business from, any company mentioned in this report. For institutional clients of the European Economic Area (EEA): This document (and any attachments or exhibits hereto) is intended only for EEA Institutional Clients or others to whom it may lawfully be submitted. There is no assurance that any of the trends mentioned will continue in the future. Past performance is not indicative of future results.


