Exiting Zero Interest Rate Policy
Drew O’Neil discusses fixed income market conditions and offers insight for bond investors.
At their meeting last week (November 3), the FOMC announced that they would begin tapering their $120 billion in monthly purchases of Treasuries and agency mortgage-back securities this month to the tune of a $15 million reduction per month. With that announcement behind us, market participants are now turning their attention to discussing when the FOMC will choose to exit ZIRP (Zero Interest Rate Policy) and raise the Fed Funds rate from the current range of 0.00-0.25%. While that is an important topic of conversation, today I want to address what that really means for fixed income investors.
To start with, we need to remember that when we hear that “the Fed is raising rates,” what they are actually doing is raising the Fed Funds rate, which is an overnight rate. What it does not mean is that the Fed is increasing yields across the entire yield curve. When the Fed “raises rates,” it can have a strong effect on the short-end of the Treasury curve, but the further you move out on the curve (longer maturities), the less effect it generally has. The intermediate and long parts of the curve tend to take direction more from the global macroeconomic environment and less from what is happening with an overnight interest rate.
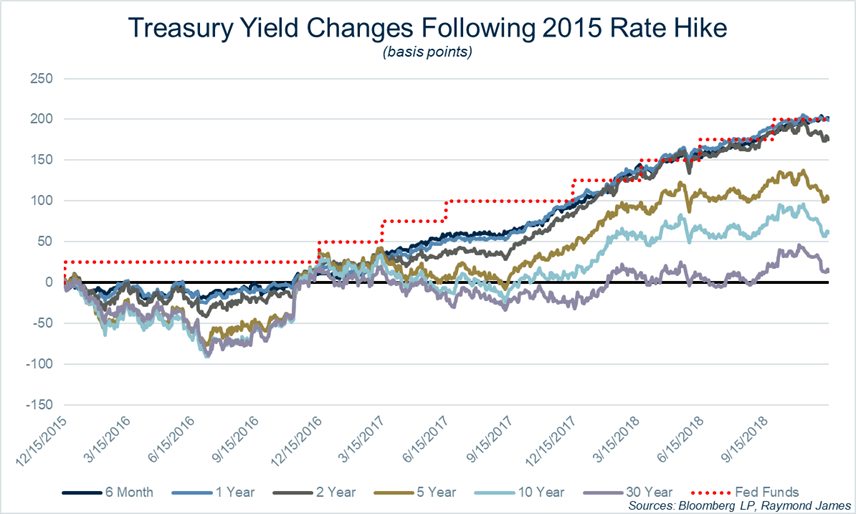
While no one knows what is going to happen in the future and acknowledging that just because something happened in the past, there is no guarantee that history will repeat itself. Let’s take a look at what happened to the yield curve the last time the Fed exited a ZIRP environment. The graph below shows the path of Treasury yields, ranging from the 6 month T-bill to the 30-year long bond, from the date that the Fed exited ZIRP (12/15/15) for the next three years. Note that the black line represents zero (no change), so anything below that line means that yields were lower, above the line means yields were higher.
This graph should provide some food for thought for those assuming that the Fed raising the Fed Funds rate means that all rates are moving higher. A few notable points:
- For the 11 months following the initial rate hike (through Nov. 4, 2016), the entire yield curve was lower in yield, not higher.
- Throughout the entire three year period, it is clear that shorter maturity bonds rose much more substantially than intermediate and long maturity bond. Shorter maturities (the 6-month, 1-year, and 2-year) somewhat track the Fed Funds rate, while longer maturities are much less correlated.
- Looking at intermediate and long maturities, where many investors are positioning their fixed income portfolio, it was a full two years before any spot on the curve 5 years or longer had increased by at least 50 basis points from where it started.
- At no point over the three year period did the 10-year increase by more than 100 basis points or the 30-year increase by more than 50 basis points. The Fed Funds rate was raised by a total of 200 basis points over the three year timeframe.
- A full three years after the Fed began “raising rates”, the 30-year Treasury had increased by just 14 basis points.
Again, I am not claiming that this is what is going to happen the next time the Fed exits ZIRP, but it is worth considering that the Fed “raising rates” does not necessarily mean that yields everywhere are moving higher. For the many investors waiting on the sidelines until the Fed starts exits ZIRP, consider the scenario that yields don’t move substantially higher over the next few years. Would you be better off investing today than sitting in cash and earning next to nothing for the next 6, 12, or 24 months? If you are waiting for higher yields to invest, what if rates don’t move substantially higher for the next 5 or 10 years? Is abandoning a fixed income allocation all together part of your long-term plan?
To learn more about the risks and rewards of investing in fixed income, please access the Securities Industry and Financial Markets Association’s “Learn More” section of investinginbonds.com, FINRA’s “Smart Bond Investing” section of finra.org, and the Municipal Securities Rulemaking Board’s (MSRB) Electronic Municipal Market Access System (EMMA) “Education Center” section of emma.msrb.org.
The author of this material is a Trader in the Fixed Income Department of Raymond James & Associates (RJA), and is not an Analyst. Any opinions expressed may differ from opinions expressed by other departments of RJA, including our Equity Research Department, and are subject to change without notice. The data and information contained herein was obtained from sources considered to be reliable, but RJA does not guarantee its accuracy and/or completeness. Neither the information nor any opinions expressed constitute a solicitation for the purchase or sale of any security referred to herein. This material may include analysis of sectors, securities and/or derivatives that RJA may have positions, long or short, held proprietarily. RJA or its affiliates may execute transactions which may not be consistent with the report’s conclusions. RJA may also have performed investment banking services for the issuers of such securities. Investors should discuss the risks inherent in bonds with their Raymond James Financial Advisor. Risks include, but are not limited to, changes in interest rates, liquidity, credit quality, volatility, and duration. Past performance is no assurance of future results.
Stocks are appropriate for investors who have a more aggressive investment objective, since they fluctuate in value and involve risks including the possible loss of capital. Dividends will fluctuate and are not guaranteed. Prior to making an investment decision, please consult with your financial advisor about your individual situation.


