
GDP: Arithmetic and Forecasting
Chief Economist Scott Brown discusses current economic conditions.
Estimates of 4Q19 GDP growth fell sharply in mid-November, but rebounded in the last week. For example, the Atlanta Fed’s GDP Now model fell to 0.3% annual rate following the October reports on retail sales and industrial production. Currently, the Atlanta Fed’s estimate stands at 1.7%, reflecting better-than-expected figures on durable goods shipments and a drop in imports. We’re still missing data for most of the fourth quarter, and the picture will change as more information becomes available. However, the underlying story may not change much.
There are two broad approaches to forecasting current quarter GDP. Some economists will estimate a number and stick with it. Most will adjust their forecasts as new data arrive. This may seem fickle to the casual observer. Estimates will change week to week and even day to day (as with the Atlanta Fed’s model). Most economists forecast the GDP components and add them up. The difference is how the components are estimated.
Consumer spending accounts for 68% of GDP. About 69% of that is services, led by housing and healthcare. Durable goods make up about 10.6% of consumer spending, but account for much of the variability in an economic downturn (durables include motor vehicles, home furnishings, and appliances – “big-ticket” purchases). Note that consumer spending growth tends to be uneven from quarter to quarter. This holiday shopping season is expected to be strong, especially in comparison to last year’s disappointing results. However, the seasonally adjusted gain from 3Q19 is unlikely to be as stellar.
Business fixed investment is generally 13-14% of GDP, and includes both old style (machinery and equipment) and new style (computers, software) capital spending. It is made up of structures (21%), equipment (43%), and intellectual property products (36%). Intellectual property products consists of software (41%), research and development (50%), and “entertainment, literary, and artistic originals” (9%). Business fixed investment accounts for most of the swing in recessions and recoveries.
Residential fixed investment, mostly homebuilding, was 3.7% of GDP in 3Q19. As a percentage of GDP it rose to about 6% during the housing boom and fell to around 2% during the bust. Traditionally, homebuilding has been the canary in the coal mine, weakening early in a recession and rebounding sharply in a recovery. However, the 2007-09 financial crisis changed all that. Residential fixed investment improved in 3Q19, following a six-quarter decline.
These three components, consumer spending, business fixed investment, and residential investment make up Private Domestic Final Purchases (PDFP), the preferred measure of underlying private-sector domestic demand. Equivalently, PDFP is GDP less government, net exports, and the change in inventories. PDFP is less volatile than GDP.
Government consumption and investment includes both federal (38%) and state and local government (62%). Defense accounted for 59% of the federal government component of GDP in 3Q19. Note that transfer payments, such as Social Security, do not appear in GDP.
The change in inventories contributes to the level of GDP. Hence, the change in the change in inventories contributes to GDP growth. That is, if inventory growth was faster than the previous quarter, that adds to GDP growth. If inventories rose at a slower pace, that subtracts from GDP growth. Last week, the estimate of 3Q19 GDP growth was revised to a 2.1% annual rate, vs. 1.9% in the advance estimate. Most of that revision was due to faster inventory accumulation.
In 3Q19, exports were 11.6% of GDP, while imports were 14.6% of GDP. Imports have a negative sign in the GDP calculation. Last week, the merchandise trade deficit narrowed unexpectedly in October, largely reflecting a drop in imports. Granted, it’s only one month, but the advance October trade data led to an upward revision in economists’ estimates of 4Q19 GDP growth. Monthly trade figures are erratic. So it’s hard to say how much of an impact trade tariffs are having in the GDP data. Anecdotally, there is evidence that firms have adjusted supply chains and stockpiled supplies and materials – but it’s hard to see in the aggregate data.
Piecing together the 4Q19 GDP growth picture helps in forecasting 2020. At this point, consumer spending growth is expected to advance at a moderate pace, supported by continued growth in jobs and wages. We are more likely to face constraints in the labor market, although the unemployment rate may drift a little lower. Business fixed investment is expected to be mixed, but generally moderate, reflecting ongoing impacts from slower global growth and trade policy. In cutting short-term interest rates, the Fed has provided some insurance, but the risks to the growth outlook remain primarily to the downside.
Data Recap – Chair Powell continued to suggest that Fed policy will remain on hold. The estimate of 3Q19 GDP growth was revised higher, but mostly due to faster inventory growth. The merchandise trade deficit narrowed unexpectedly in October (likely adding to 4Q19 GDP growth, since imports have a negative sign in the calculation). Durable goods orders surprised to the upside.
In his speech on “Building on the Gains from the Long Expansion,” Fed Chair Powell focused on two themes, “maintaining a stable and reliable pace of 2 percent inflation and spreading the benefits of employment more widely.” He said that “monetary policy is now well positioned to support a strong labor market and return inflation decisively to our symmetric 2 percent objective.” However, “if the outlook changes materially, policy will change as well.”
The Fed’s Beige Book noted the “economic activity expanded modestly” through mid-November. Employment “continued to rise slightly,” as labor markets remained tight in most areas. Wage growth was “moderate,” although “wage pressures intensified for low-skill positions.” Firms’ ability to raise prices to cover higher costs remained limited, though a few Fed districts noted that “companies affected by the tariffs were more inclined to pass on cost increases.”
Real GDP rose at a 2.1% annual rate in the 2nd estimate for 3Q19 (vs. +1.9% in the advance estimate). Most of the revision was due to faster inventory growth (which may unwind in 4Q19). Revisions for the key components were small (consumer spending +2.9%, business fixed investment
-2.7%, and residential fixed investment +5.1%).
In the Advance Economic Indicators report, the merchandise trade deficit narrowed to $66.5 billion in October, from $70.5 billion in September (unrevised). Exports fell by $0.9 billion or 0.7% (-3.7% y/y). Imports fell by $5.0 billion or 2.4% (-6.9% y/y), following a $4.3 billion drop in September. Imports of consumer goods fell by $2.6 billion or 4.8% (-7.8% y/y).
Personal Income was unchanged in October (+4.4% y/y), reflecting a pullback in farm subsidies (ex-farm income, personal income rose 0.2% m/ m and 3.8% y/y). Aggregate wages and salaries rose 0.4% (+4.9% y/y). Personal Spending rose 0.3% (+3.7% y/y), but up 0.1% excluding food & energy (+2.3% y/y). The PCE Price Index rose 0.2% (+1.3% y/y), up 0.1% ex-food & energy (+1.6% y/y).
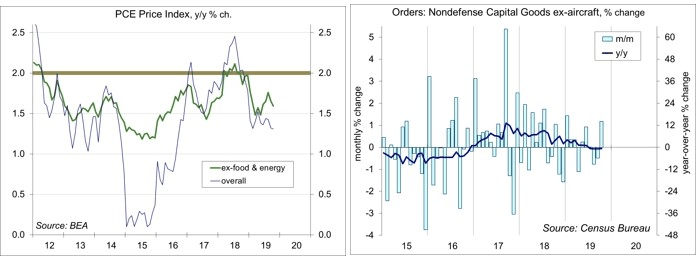
Durable Goods Orders rose 0.6% in October, reflecting the GM strike, but surprisingly missing weakness in aircraft orders (motor vehicles -1.9%, civilian aircraft +10.7%, defense aircraft +18.1%). Ex-transportation, orders rose 0.2%. Orders for nondefense capital goods ex-aircraft rose 1.2%, offsetting weakness in August and September (orders were down 0.1% over the last three months).
The Conference Board’s Consumer Confidence Index edged down to 125.5 in the initial estimate for November, vs. 126.1 in October. Expectations improved (consistent with moderate strength in consumer spending), while evaluations of current conditions deteriorated (consistent with softness in the overall economy). The year-over-year change in the present situation index fell to -5.8 (a sub-zero reading has often preceded past recessions).

The Chicago Fed National Activity Index fell to -0.71 in the initial estimate for October, likely reflecting the impact of the GM strike. At -0.31, the three-month average was consistent with growth below the long-term trend (a three-month average below -0.70 indicates an increasing likelihood that a recession has begun).
New Home Sales slipped 0.7%, to a 733,000 seasonally adjusted annual rate in the initial estimate for October, while September’s total was revised higher. Unadjusted sales for August-October were up 25.0% y/y (Northeast +14.3%, Midwest -5.6%, South +34.2%, West +16.2%).

The Pending Home Sales Index fell 1.7% in October (+4.4% y/y). The National Association of Realtors noted a limited number of affordable homes for sale.
The Chicago Business Barometer rose to 46.3 in November, vs. 43.2 in October, still in contraction.
The opinions offered by Dr. Brown should be considered a part of your overall decision-making process. For more information about this report – to discuss how this outlook may affect your personal situation and/or to learn how this insight may be incorporated into your investment strategy – please contact your financial advisor or use the convenient Office Locator to find our office(s) nearest you today.
All expressions of opinion reflect the judgment of the Research Department of Raymond James & Associates (RJA) at this date and are subject to change. Information has been obtained from sources considered reliable, but we do not guarantee that the foregoing report is accurate or complete. Other departments of RJA may have information which is not available to the Research Department about companies mentioned in this report. RJA or its affiliates may execute transactions in the securities mentioned in this report which may not be consistent with the report’s conclusions. RJA may perform investment banking or other services for, or solicit investment banking business from, any company mentioned in this report. For institutional clients of the European Economic Area (EEA): This document (and any attachments or exhibits hereto) is intended only for EEA Institutional Clients or others to whom it may lawfully be submitted. There is no assurance that any of the trends mentioned will continue in the future. Past performance is not indicative of future results.