
GDP, the FOMC, and NFP
Chief Economist Scott Brown discusses current economic conditions.
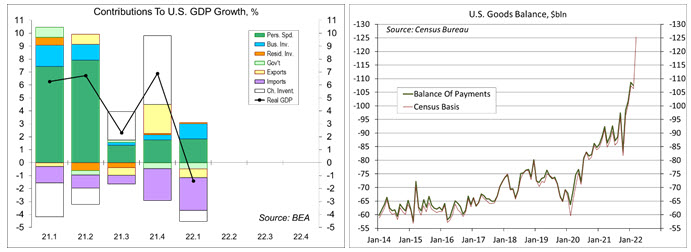
Real Gross Domestic Product fell at a 1.4% annual rate in the advance estimate for 1Q22. Imports have a negative sign in the GDP calculation. However, imports do not subtract from GDP. Consumer spending and business fixed investment were strong. Monthly data suggest good momentum into 2Q22. Fed rate increases and forward guidance (a signal of future rate increases) should moderate the pace of growth in the remainder of the year, but the risks to the growth outlook are weighted more to the downside. The labor market will be the key data to watch in the months ahead.
Y = C + I + G + (X – I). GDP equals personal consumption expenditures plus investment plus government plus net exports (exports minus imports). Personal consumption expenditures, which account for about 70% of GDP, are consumer spending on goods and services. Investment is business fixed investment (business equipment, business structures, and intellectual property products, such as computer software), residential fixed investment (homebuilding and home repairs), and the change in inventories. Government is federal, state, and local government consumption and investment (roads and bridges, police, teachers, defense aircraft, etc.). Exports are U.S. goods and services consumed overseas. Imports are foreign goods and services consumed here.
Imports have a negative sign in the GDP calculation, but imports do not subtract from GDP. Imports show up indirectly in consumer spending, business and residential fixed investment, inventories, and government. We are interested in domestic output, so rather than trying to separate consumer spending of domestic goods from consumer spending of imported goods, which count overall consumer spending and back out (that is, subtract) imports. If you buy a new Ferrari, that counts as consumer spending, but it also shows up as an import. Imports have no impact on GDP.
The U.S. merchandise trade deficit rocketed to a record $125.3 billion in March, reflecting a large increase in exports and an even larger increase in imports. Net exports subtracted 3.2 percentage points from the headline GDP growth figure.
Inventories are a stock ($), while GDP is a flow ($/time). The change in inventories ($/time) contributed to the level of GDP. The change in the change in inventories contributes to GDP growth. Inventories fell at a $66.8 billion annual rate in 3Q21 and rose at a $192.3 billion annual rate in 4Q21. The difference added 5.3 percentage points to the estimate of 4Q21 GDP growth (+6.9%). Inventories rose at a $158.7 billion pace in 1Q22 – still strong, but slower than in 4Q21 – the difference subtracted 0.8 percentage point from headline GDP growth.
Government consumption and investment fell at a 2.7% annual rate in 1Q22 (federal defense -8.5%, federal nondefense -2.2%, state and local down 0.8%), subtracting 0.5 percentage point from headline GDP growth.
Private Domestic Final Purchases (PDFP), GDP less net exports, the change in inventories, and government (or equivalently, consumer spending plus business fixed investment plus residential fixed investment), rose at a 3.7% annual rate in 1Q22 (+4.4% y/y). While the headline GDP figure gets all the attention, PDFP is a better measure of underlying domestic demand.
Federal Reserve policymakers are aware of all this, so the negative GDP growth figure for 1Q22 should not prevent them from raising short-term interest rates this week. The PCE Price Index, the Fed’s key inflation gauge rose, 0.9% in March, up 6.6% from a year ago (+5.2% y/y ex-food & energy). In the Fed’s views, elevated inflation is a consequence of imbalances between supply and demand. We can see that in the downtrend in the unemployment rate and the surge in the trade deficit – these are signs that U.S. growth is beyond a long-term sustainable pace. The Fed can’t do much about supply, but it can work to slow demand by raising rates – and the forward guidance (of future rate increases) should do most of the heavy lifting.
The Fed fears that, as an inflationary mindset becomes more entrenched, a wage-price spiral will develop. There are some tentative signs of that. It’s good that people have jobs, but labor market conditions are especially tight. We could get some relief if labor force participation were to pick up more significantly, but that seems unlikely. Expectations of aggressive Fed tightening are having an impact on the rest of the world. We’ve seen a strengthening of the dollar, which could lead to more unsettled global financial conditions, but the Fed’s got to do what the Fed’s got to do (on inflation).
As a reminder, the unemployment rate is a lagging indicator, nonfarm payrolls are a coincident indicator, and weekly jobless claims are a leading indicator. We have yet to see a moderation in labor demand.
Recent Economic Data
Real GDP fell at a 1.4% annual rate in the advance estimate for 1Q22, reflecting slower inventory accumulation, lower exports, and a drop in government consumption and investment. Imports, which are a subtraction in the GDP calculation, increased. Real consumer spending rose at a moderate 2.7% annual rate. Business fixed investment rose 9.2%. Net exports subtracted 3.20 percentage points from the headline growth figure, while the change in inventories subtracted 0.84 ppt.
The merchandise trade deficit widened to a record $125.3 billion in March, following $106.3 billion in February. Exports rose 7.2% (+18.1% y/y) not adjusted for inflation, while imports rose 11.5% (+25.6% y/y).
Personal income rose 0.5% in the initial estimate for March, led by a 0.6% gain in private-sector wages and salaries (+12.8% y/y). Disposable income rose 0.5%, but fell 0.4% adjusting for inflation.
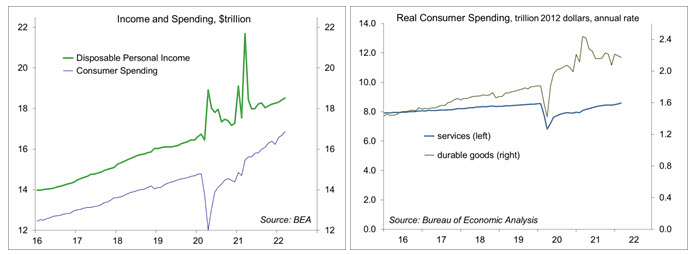
Personal spending rose 1.1% in March (+9.1% y/y), reflecting a 1.0% decline in spending on durables, a 2.5% increase in nondurables (higher prices), and a 1.1% gain in services. Adjusted for inflation, consumer spending rose 0.2% (+2.3% y/y) – a moderate trend heading into 2Q22.
Annual benchmark revisions to the retail sales data showed a 13.6% annual rate of growth in the first quarter (down from the previous estimate of 17.7%). Seasonal adjustment for December and January still seems suspicious, but not as bad as before the revisions.
The PCE Price Index rose 0.9% in March (+6.6% y/y), partly reflecting an 18.0% rise (+48.2% y/y) in gasoline. Ex-food & energy, the PCE Price Index rose 0.3% (+5.2% y/y).
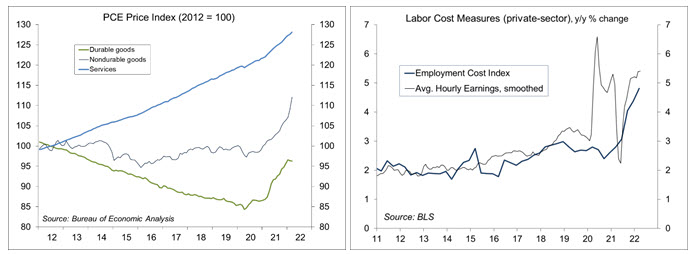
The Employment Cost Index, the preferred gauge of labor cost pressures and watched closely by Fed policymakers, rose 1.4% over the three months ending in March (+4.5% y/y, vs. +2.6% y/y a year ago). For the private sector, the ECI rose 1.4% (+4.8% y/y, vs. +2.8% y/y a year ago).
Durable goods orders rose 0.8% in the initial estimate for March, leaving the first quarter total up 12.6% from a year earlier. Orders for motor vehicles jumped 5.0%. Ex-transportation, orders rose 1.1%. Orders for nondefense capital goods ex-aircraft rose 1.0%. The Advance Total Manufacturing report, released at the same time, showed a 2.2% increase in factory shipments and a 1.3% increase in manufacturing inventories.
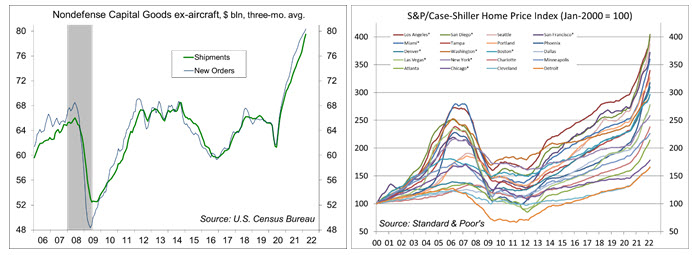
The Case-Schiller National Home Price Index rose another 1.9% in February, up 19.2% y/y. Twelve-month increases were led by Phoenix (+32.9%), Tampa (32.6%), Miami (+29.7%), and San Diego (+29.1%).
The Conference Board’s Consumer Confidence Index was little changed at 107.3 in the initial estimate for April. Job market perceptions were less optimistic, but very strong by historical standards.
The University of Michigan’s Consumer Sentiment Index was 65.2 in April, vs. 65.7 at mid-month and 59.4 in March (the survey ran from March 23 to April 25).
New home sales fell 8.6% in the initial estimate for March (+3.8% before seasonal adjustment), to a 763,000 seasonally adjusted annual rate (-12.6% y/y).
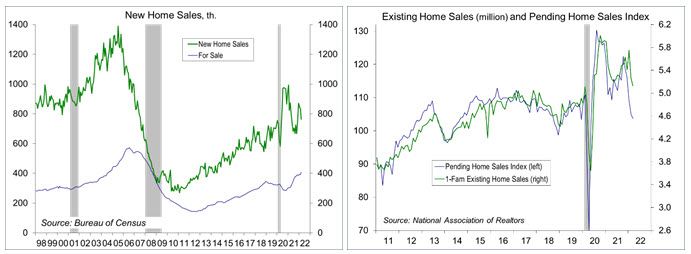
The Pending Home Sales Index fell 1.2% in March, down 8.2% from a year ago. Demand still appears strong, but higher mortgage rates have reduced affordability and should dampen the pace of price increases.
The Chicago Fed National Activity Index, a composite of 85 economic indicators, fell to 0.44 in March, from
0.54 in February. The three-month average was 0.57, consistent with above-trend growth in the near term.
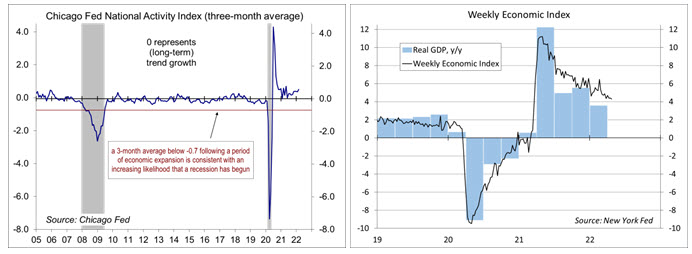
The New York Fed’s Weekly Economic Index edged down to 4.31 in week ending April 23. Real GDP rose 3.6% y/y in 1Q22, with Private Domestic Final Purchases rose 4.4% .
Jobless claims were little changed at 180,000 in the week ending April 23. The four-week average was 179,750, consistent with a very tight labor market.
The opinions offered by Dr. Brown are provided as of the date above and subject to change. For more information about this report – to discuss how this outlook may affect your personal situation and/or to learn how this insight may be incorporated into your investment strategy – please contact your financial advisor or use the convenient Office Locator to find our office(s) nearest you today.
This material is being provided for informational purposes only. Any information should not be deemed a recommendation to buy, hold or sell any security. Certain information has been obtained from third-party sources we consider reliable, but we do not guarantee that such information is accurate or complete. This report is not a complete description of the securities, markets, or developments referred to in this material and does not include all available data necessary for making an investment decision. Prior to making an investment decision, please consult with your financial advisor about your individual situation. Investing involves risk and you may incur a profit or loss regardless of strategy selected. There is no guarantee that the statements, opinions or forecasts provided herein will prove to be correct.