In The Mix
Data delayed due to the government shutdown have begun to arrive, filling in the picture for 4Q18, and we’re also getting fresher data on the economy in early 2019. The figures have been mixed, and often surprising, which allows one to make about any kind of argument one wants. However the data are also consistent with a slower pace of economic growth. For financial market participants and Federal Reserve officials, expectations of the economy may be in flux, but are likely to remain positive.
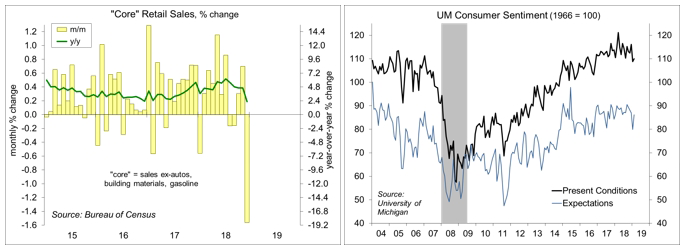
The biggest shocker among recent economic data reports was the unexpected plunge in retail sales in December. As expected, motor vehicle sales rose and gasoline sales fell (reflecting lower prices). Core sales were expected to have risen modestly, but fell 1.6% instead. Now, it’s important to remember that the retail sales report is based on a statistical sample, so there is a fair amount of uncertainty. Seasonal adjustment is often tricky, especially in December. It’s possible that the partial government shutdown had an impact, either through creating problems with the data collection or by dampening spending. In its report, the Bureau of Census never supplies any color (for example, if sales might have been effected by adverse weather). Most government shutdowns tend to be short, holiday sales are fueled more by credit, the first missed paycheck wasn’t until January 11, and federal workers expected to be paid eventually. Still, there may have been secondary effects (unpaid government contractors), spending may have been curtailed due to all the talk of a possible recession, and workers may have just been a lot more sensitive to disruptions than we think. Take the December data with a grain of salt (although auto loan delinquencies are on the rise). The figures are subject to revision. Note that January and February data, to be released in the weeks ahead, may not help to clarify the consumer picture (as these are the seasonal doldrums for most retailers). So, while the “strong consumer” scenario may be at risk, the bigger test will come in the spring – and the fundamentals of the household sector still appear strong.
Retail sales account for about a quarter of consumer spending and consumer spending accounts for 68% of Gross Domestic Product. Hence, the report has led economists to lower their expectations for 4Q18 growth. Inventory data also suggest a much slower pace of accumulation, which subtracts from headline GDP growth.
Consumer and business expectations dropped in January, but it appears that much of the decline in consumer attitudes was related to the government shutdown. The University of Michigan’s Consumer Sentiment Index rebounded in the report for mid-February, and we likely would have seen a bigger bounce if not for concerns about a possible second shutdown (since averted).
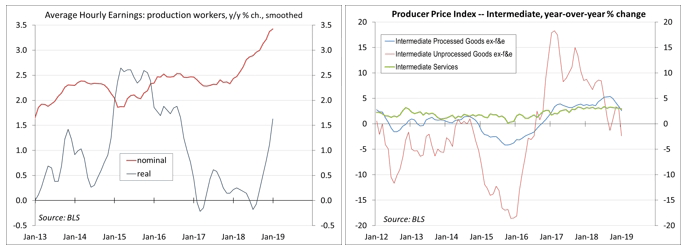
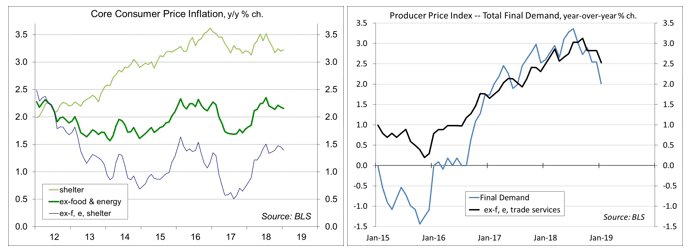
Meanwhile, the Consumer Price Index edged lower in January. As a results, real (that is, inflation-adjusted) earnings have risen significantly in the last few months – especially for production workers (+2.1% y/y). Ex-food & energy, the price index for consumer goods posted a 0.4% gain in January, but that is nothing to worry about. Firms often try to raise prices of consumer goods in January, just to see if they stick. Seasonal adjustment can be quirky. The Producer Price Index also edged lower, but the details of the report showed a moderation in pipeline inflation pressures. Import prices also dipped, with the rise in prices of raw materials that we saw in the first half of 2018 essentially unwinding into the start of 2019. Those figures do not directly include tariffs, but the inflation outlook is more benign, consistent with Federal Reserve policy being on hold for the foreseeable future.
Looking ahead, there are more questions to be answered by the economic data in the weeks ahead. Orders and shipments of capital goods appeared to weaken in October and November. We’ll get December figures this week. The “initial” estimate (a combination of the advance and 2nd estimates) will be released on February 28. Still, investors are more likely to be interested in the future than in the past.
The minutes of the January 29-30 Federal Open Market Committee meeting (released on February 20) ought to show policymakers to be a little more divided. However, Chairman Powell has already made it clear that, while the baseline outlook for the economy hasn’t changed, the downside risks have increased. Some of those risks may be fading. Look to the Federal Reserve’s Monetary Policy Report to Congress (to be released on the morning of February 22) and Powell testimony (on February 26 and 27) to provide important color.
Data Recap – Financial market participants continued to focus on negotiations on trade policy and the federal budget, although we also saw some reactions to surprises in the economic data.
Congress reached, and the President Trump signed, a Budget Agreement that avoids another government shutdown. The University of Michigan’s Consumer Sentiment Index rebounded to 95.5 in mid-February, vs. 91.2 in January and 98.3 in December. The headline figure might have even been higher if not for concerns that we might have had a second government shutdown. Respondents were the most optimistic about inflation-adjusted income growth in 15 years.
Retail Sales fell 1.2% in the advance estimate for December (+2.3% y/y). Motor vehicle sales rose 1.0% (+3.4% y/y), as expected. Gasoline sales fell 5.1% (-0.2% y/y), due to lower prices. Ex-vehicles, building materials, and gasoline, sales tumbled 1.6% (+2.3% y/y) – a 0.3% annual rate in 4Q18 (vs. +5.2% in 3Q18).
Business Inventories fell 0.1% in November (+4.6% y/y). Retail inventories, the only new information in this report, fell 0.4% (autos +0.5%, exautos -1.0%). Manufacturing inventories (reported earlier) slipped 0.1% and wholesale inventories rose 0.3%. Business sales fell 0.3% in November (+4.2% y/y). The inventory data suggest a slower pace of accumulation in 4Q18, which would subtract from GDP growth.
Industrial Production fell 0.6% in the initial estimate for January (+3.8% y/y). Manufacturing output fell 0.9%, offsetting the 0.9% gain in December (+3.1% y/y). Motor vehicle output fell 8.8%, vs. +4.3% in December (-0.7% y/y). Ex-motor vehicles, manufacturing slipped 0.2%, following a 0.5%
rise in December (+3.1% y/y). The output of utilities rose 0.4%, following a 6.9% drop in December (-5.6% y/y). Mining edged up 0.1% (+17.4% y/ y), with oil and gas well drilling down 0.9% (+15.3% y/y) and extraction up 1.1% (+17.4% y/y).
The Consumer Price Index was unchanged in January (+1.6% y/y). Food rose 0.2% (+1.6% y/y), while energy fell 3.1% (-4.8% y/y). Gasoline prices dropped 5.5% (-5.2% before seasonal adjustment, and -10.9% y/y). Ex-food & energy, prices of consumer goods rose 0.4% (+0.7% before seasonal adjustment, +0.3% y/y). Non-energy services rose 0.2% (+0.3% before seasonal adjustment, +2.8% y/y).
Real Hourly Earnings rose 0.2% in January (+1.7% y/y), also up 0.2% for production workers (+2.1% y/y).
The Producer Price Index slipped 0.1% in January (+2.0%). Food fell 1.7% (+1.4% y/y), while energy dropped 3.8% (-7.5% y/y). Trade services rose 0.3% (+2.8% y/y). Ex-food, energy, and trade services, the PPI rose 0.2% (+2.5% y/y). Ex-food & energy, unprocessed intermediate goods fell 2.4% y/y, with processed intermediate goods down 0.3% y/y. These figures do not directly include tariffs, but tariffs may be passed through to some intermediate goods. Intermediate services rose 2.9% y/y.
Import Prices fell 0.5% in January (-1.7% y/y), down 0.2% ex-food & fuels (0.0% y/y). Ex-fuels, prices of imports industrial supplies and materials fell 0.7% (-0.1% y/y). Prices of imported capital goods edged up 0.1% (-0.1% y/y). Prices of imported autos and parts fell 0.2% (-0.4% y/y). Prices of imported consumer goods ex-autos fell 0.3% (+0.3% y/y). These figures do not include tariffs.
The Index of Small Business Optimism slipped to 101.2 in January, vs. 104.4 in December (it had reached a record high of 108.8 in August). The general business outlook softened further. Sales expectations edged lower. Hiring plans remained strong (although slower than in recent months). Capital spending plans remained moderately strong.
Job Openings rose to a record 7.3 million on the last business day in December.
The opinions offered by Dr. Brown should be considered a part of your overall decision-making process. For more information about this report – to discuss how this outlook may affect your personal situation and/or to learn how this insight may be incorporated into your investment strategy – please contact your financial advisor or use the convenient Office Locator to find our office(s) nearest you today.
All expressions of opinion reflect the judgment of the Research Department of Raymond James & Associates (RJA) at this date and are subject to change. Information has been obtained from sources considered reliable, but we do not guarantee that the foregoing report is accurate or complete. Other departments of RJA may have information which is not available to the Research Department about companies mentioned in this report. RJA or its affiliates may execute transactions in the securities mentioned in this report which may not be consistent with the report’s conclusions. RJA may perform investment banking or other services for, or solicit investment banking business from, any company mentioned in this report. For institutional clients of the European Economic Area (EEA): This document (and any attachments or exhibits hereto) is intended only for EEA Institutional Clients or others to whom it may lawfully be submitted. There is no assurance that any of the trends mentioned will continue in the future. Past performance is not indicative of future results.


