Looking Back, Looking Ahead
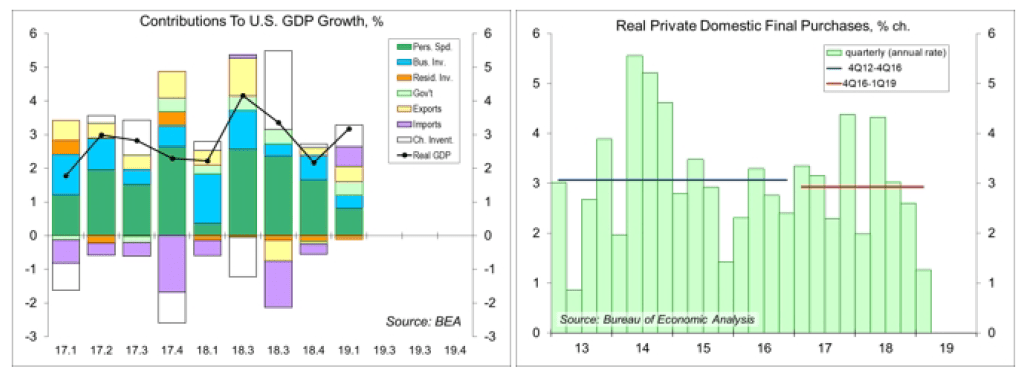
The advance GDP report was a mixed bag. The headline figure was stronger than expected, but boosted by faster inventory growth and a narrower trade deficit, both of which are likely to reverse in the second quarter. Consumer spending and business fixed investment slowed, while residential fixed investment fell for the fifth consecutive quarter. The first quarter’s softness in underlying domestic demand likely reflected an impact from the partial government shutdown, and these key components of the economy are expected to rebound in 2Q19. Still, we’ll need to see proof of that in upcoming economic data reports.
Investors place far too much weight on the headline GDP figure. First quarter growth figures will be revised, and revised, and revised again over the next few months. The 2nd estimate is due May 30, the 3rd estimate arrives on June 27, and annual benchmark revisions are set to be released on July 26 (along with the advance estimate of 2Q19). However, the underlying story ought not to change much.
Private Domestic Final Purchases, consumer spending plus business fixed investment plus residential fixed investment (or equivalently, GDP less net exports, the change in inventories, and government) rose at a 1.3% annual rate in 1Q19 (vs. +2.6% in 4Q18), up 2.8% year-over-year. Growth in underlying domestic demand was almost certainly restrained by the partial government shutdown (December 22 to January 35, the longest on record). However, it’s hard to say exactly how much. March figures on retail sales and capital goods orders point to a rebound, but the underlying trends appear to be lackluster to moderate.
We’ll get personal income data for March on Monday (April 29) and the Friday’s employment report (May 3) will give us a good idea of wage and salary income for April. Monday’s report will also include spending figures for February and March (the February figures were delayed due to the government shutdown). We’ll also get some clues in the details of the employment report. Retail, manufacturing, and temp-help payrolls each fell in March, not a good sign – and a further drop in April would be a red flag.
The PCE Price Index rose at a 0.6% annual rate in 1Q19 (+1.4% y/y), restrained by lower energy prices, which had begun to turn higher in March. Ex-food & energy, the PCE Price Index rose at a 1.3% pace (+1.7% y/y), below the Fed’s 2% goal. Low inflation allows the Fed the luxury of waiting to decide its next move. The odds of a Fed rate cut by the end of the year, as reflected in the federal funds futures market, have varied widely in recent weeks – from nearly 75% in late March, to about 28% on April 16, and back up to about 65% more recently.
The Federal Open Market Committee is widely expected to leave short-term interest rate unchanged following the two-day policy meeting (announcement due at 2:00 p.m. on May 1). There will be no revised Fed forecasts this time – no new dot plot. Inventors will focus on Chairman Powell’s press conference, where he is almost certain to be asked about the low inflation trend and about the specific conditions that would prompt the Fed to cut rates in the months ahead. Powell should add further color to this year’s ongoing discussion of the Fed’s monetary policy framework – its strategies, tools, and communication policies. The first quarter’s low inflation figures should further fuel the discussion on whether the Fed should shift to a price level-targeting system (where periods of low inflation would prompt a push for higher inflation to make up the shortfall for the current 2% goal).
The first quarter’s softness in domestic demand is expected to be followed by stronger results in 2Q19. However, slower inventory growth and a wider trade deficit are expected to subtract from second quarter growth. Economic figures are noisy. The numbers are subject to statistical noise and seasonal adjustment uncertainty. Figures will almost certainly be mixed. This noise could lead to some volatility in the financial markets. The underlying trend in domestic demand is likely to be moderate, and the risks are still more prominent further out this year and into 2020.
Data Recap – GDP rose more than expected in the advance estimate for 1Q19. However, the headline growth figure was inflated by faster inventory growth (well beyond a sustainable pace) and a narrower trade deficit (trade policy concerns appear to have pulled forward imports into 2018). Underlying domestic demand was relatively soft, but that may reflect an impact from the partial government shutdown – hence, a rebound is expected in 2Q19.
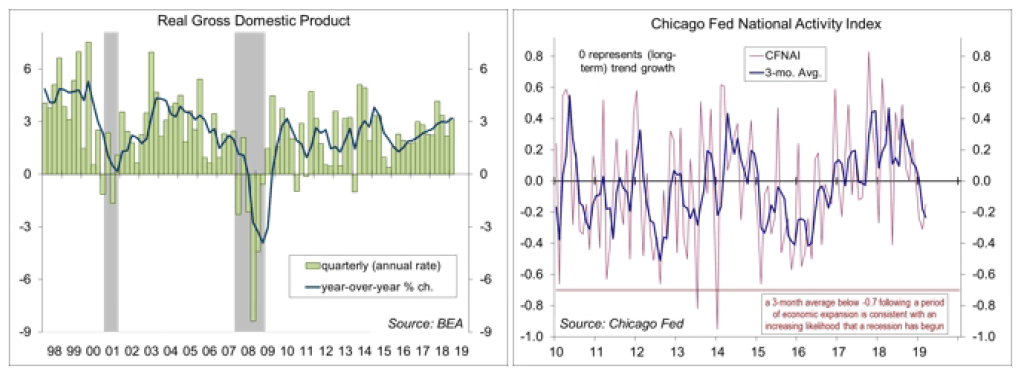
Real GDP rose at a 3.2% annual rate in the advance estimate for 1Q19 (vs. +3.2% year-over-year).
The Chicago Fed National Activity Index, a composite of 85 economic indicators, fell to -0.15 in March, vs. -0.31 in February. At -0.24, the three-month average is consistent with a below-trend rate of growth in the near term (but many of the figures that make up the CFNAI are expected to improve n April).
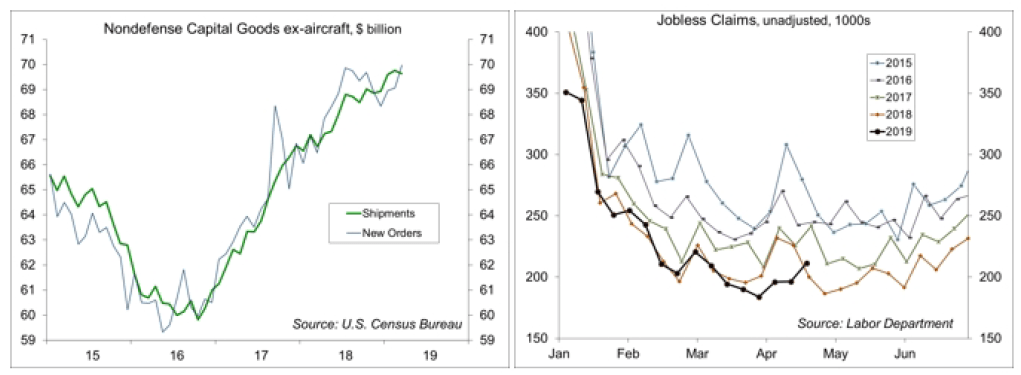
Durable Goods Orders rose 2.7% in the initial estimate for March, reflecting a surge in aircraft orders (don’t expect that to last). Transportation orders rose 7.0% (motor vehicles +2.1%, civilian aircraft +31.2%, defense aircraft +17.7%). Ex-transportation, orders rose 0.4%, with mixed results across industries. Orders for nondefense capital goods ex-aircraft rose 1.3%, while shipments for this category fell 0.2% (consistent with the soft results in business fixed investment seen in the GDP report). Ex-transportation, unfilled orders were flat, something to watch closely in the months ahead (declining unfilled orders usually coincides with weakness in the manufacturing sector).
Jobless Claims rose by 37,000, to 230,000, in the week ending April 20. It looks as the data in recent weeks may have been distorted by difficulties adjusting for the late Easter.
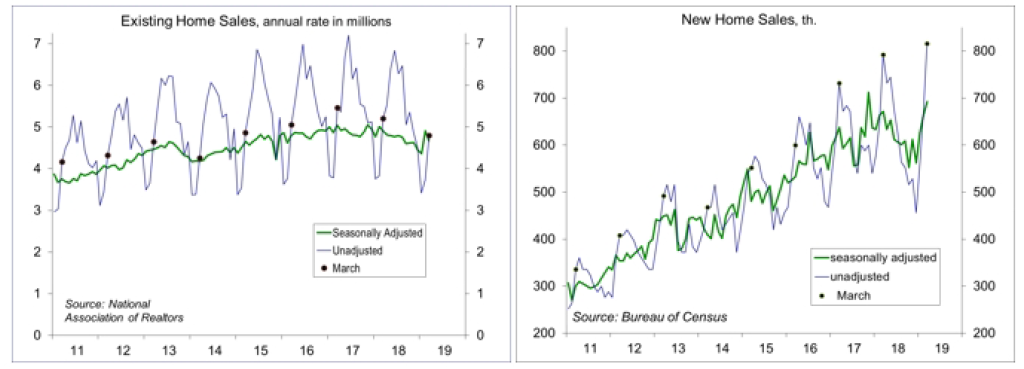
Existing Home Sales fell 4.9% in March (vs. +11.2% in February), to a 5.21 million seasonally adjusted annual rate (-5.4% y/y). Unadjusted sales for the first quarter fell 6.6% y/y, down in all regions (Northeast -2.4%, Midwest -6.6%, South -4.9%, West -11.9%). The National Association of Realtors noted that “the lower-end market is hot while the upper-end market is not – the expensive home market will experience challenges due to the curtailment of tax deductions of mortgage interest payments and property taxes.”
New Home Sales rose 4.5% (±17.6%) in the initial estimate for March, to a 692,000 seasonally adjusted annual rate, up +3.0% y/y (±11.4%). Unadjusted sales for the first quarter were 1.8% higher than a year ago, mixed across regions (Northeast -22.2%, Midwest -10.0%, South +9.8%, West -4.3%).
The Bank of Canada left short-term interest rates unchanged, but lowered its expectation for 2019 GDP growth to 1.2% (up to around 2% in 2020 and 2021).
The opinions offered by Dr. Brown should be considered a part of your overall decision-making process. For more information about this report – to discuss how this outlook may affect your personal situation and/or to learn how this insight may be incorporated into your investment strategy – please contact your financial advisor or use the convenient Office Locator to find our office(s) nearest you today.
All expressions of opinion reflect the judgment of the Research Department of Raymond James & Associates (RJA) at this date and are subject to change. Information has been obtained from sources considered reliable, but we do not guarantee that the foregoing report is accurate or complete. Other departments of RJA may have information which is not available to the Research Department about companies mentioned in this report. RJA or its affiliates may execute transactions in the securities mentioned in this report which may not be consistent with the report’s conclusions. RJA may perform investment banking or other services for, or solicit investment banking business from, any company mentioned in this report. For institutional clients of the European Economic Area (EEA): This document (and any attachments or exhibits hereto) is intended only for EEA Institutional Clients or others to whom it may lawfully be submitted. There is no assurance that any of the trends mentioned will continue in the future. Past performance is not indicative of future results.


