Losing Patience?
While the federal funds futures market is pricing in some chance (about 24%) of a rate cut this week, the Federal Open Market Committee is widely expected to leave rates steady. The market currently see a stronger probability (about 87%) of a July 31 rate cut, although that is subject to change depending on what the Fed says this week. Future policy action will remain data-dependent, but the FOMC policy statement, the revised Summary of Economic Projections (SEP), and Chair Powell press conference will set market expectations. Over the last several months, stock market participants have been hyper-sensitive to minor changes in the policy outlook.
At this point, the U.S. economy does not appear to be heading into a recession. The underlying trend in job growth has remained strong, although slower than last year (the “disappointing” 75,000 increase in nonfarm payroll in May was noise). The unemployment rate is 3.6% (2.9% for prime- age workers), the lowest in 50 years. The May retail sales data were consistent with a pickup in consumer spending growth in 2Q19 (not much of a stretch following the subpar results of the first quarter).
However, the recent economic data do not fully reflect the impact of the May 10 escalation in tariffs (the 10% tariff on $200 billion in Chinese goods was raised to 25%). A 10% tariff can be partly offset through a weaker currency (the yuan has fallen a little over 8% against the U.S. dollar over the last year), but a 25% tariff will be hard to avoid. Some production can move to other countries (Vietnamese trade is expanding rapidly), but a lot of that will take time. Moreover, the uncertainty is keeping a lot of international businesses back on their heels, reluctant to make capital expenditures. The government and the People’s Bank of China can be expected to pull out all the stops to keep the country’s economy growing strongly, but foreign trade disruptions will still be felt. China imports a lot of supplies and materials from the rest of the world. Those countries are hurting, adding to global economic weakness.
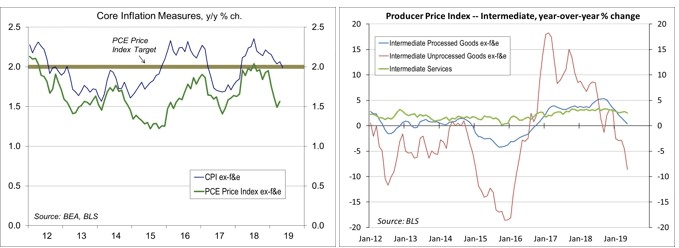
Global economic weakness appears to be putting downward pressure on commodity prices. Although they do not directly reflect tariffs, the producer price data show a decrease in pipeline inflation pressures in recent months. Most (63%) of the Consumer Price Index is services. The core CPI rose 2.0% over the 12 months ending in May, but the Fed uses the PCE Price Index for its inflation target – and year-over-year increase in the core PCE Price Index has been trending about 0.4 percentage point below the core CPI. The Fed has consistently undershot its 2% target, and recent figures ought to provide the central bank some cover to cut short-term interest rates.
It’s hard to argue that the current federal funds target range (2.25-2.50%) is all that restrictive. However, anecdotal information suggests that businesses are feeling a greater impact from tariffs. The May 10 increase in tariffs has further disrupted supply chains and dampened business confidence. The drag on the economy is much larger than the tariffs that came before, but not (by itself) enough to push the U.S. economy into a recession. However, President Trump has threatened to impose a 25% tariff on the remaining $300 billion or so in Chinese goods, mostly consumer goods. This would likely double the economic drag from tariffs, putting the economy on the cusp of a recession.
Fed policy decisions may hinge on trade policy and whether we will see a further expansion of tariffs. Low inflation should allow the Fed to make an “insurance” cut in late July. The Fed normally lowers the federal funds rate by 500 basis points during a typical recession. It currently only has 225 basis point to work with. That means, the Fed should be more aggressive in lowering short-term interest rates if it thinks it may have to. That means moving sooner or lowering rates more steeply than it would otherwise.
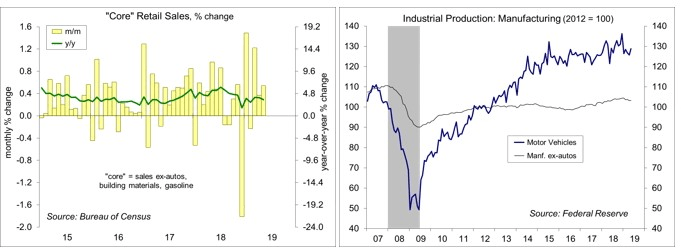
Predicting recessions is notoriously difficult. We’ve only had 11 recession since World War II. That’s a low sample size. Most prediction models of recession include the slope of the yield curve. Adding more variables will help improve the fit (“predicting” past recession better), but don’t necessarily help in forecasting the next recession. There is some debate about which yield curve spread one should focus on. Regardless, an inverted yield curve signals an expectation that short-interest rates will decline, presumably because the central bank would be worried about a weakening economy. In this way, expectations of an economic downturn, can be self-fulfilling. Indeed, business investment decision are driven primarily by the economic outlook. Tariffs have contributed to a weaker outlook. That could change if the U.S. and China reach an agreement on trade, but it would get worse if tensions increase.
A simple (yield curve) model of recessions is currently showing about a 35% chance of entering a downturn within the next 12 months. However, the odds only rose to 50% ahead of the Great Recession. That could be because interest rates are generally a lot lower than in the past, implying that the odds of recession are higher than what the model suggests.
In previous policy statements this year, the FOMC has indicated that it will be “patient” in deciding its next move. We ought to see that word disappear in this week’s statement. Instead, we’re likely to get some variation of what Chair Powell said earlier this month. That is, the Fed “will closely monitor” trade policy and other developments, and “act as appropriate” to sustain the economic expansion. That may be as close as Powell can come to signaling a July 31 cut (although he will have an additional opportunity to communicate the Fed’s intentions when he delivers his semi-annual monetary policy testimony to Congress next month).
The dots in the dot plot tend to move glacially from quarter to quarter, but we saw fairly large shifts moving from December to March. The Fed (and private economists) are divided on the dot plot. Some see it as leading to widespread misconceptions of the Fed’s policy intentions. Others, including Chair Powell, believe it to be an important part of Fed communications – “it just need to be explained better.” We should see the dots drift lower this week, with some moving below the current level. However, the dots are the year-end expectation of the federal funds rate, which tells us nothing about when the cut (or cuts) would come.
The more challenging task will be the press conference. Powell will have to make the Fed’s expectations as clear as possible. In recent months, stock market participants have been hyper-sensitive to minor changes in the Fed policy outlook. Going from a mild tightening bias at the December FOMC meeting to a neutral position in March wasn’t a major shift, but it was a huge deal for the stock market. Similarly, going from neutral to an easing bias is not necessarily a big chance. However, the market is well ahead of the Fed in its outlook for lower rates – the federal funds market is pricing in an 89% chance of two or more cuts by the end of the year – and we almost certainly won’t get a confirmation of that outlook from the Fed this week.
Data Recap – Retail sales and industrial production data for May remained consistent with moderate economic growth in the near term, although the full impact of the May 10 escalation in tariffs has yet to be fully felt. Inflation figures may give the Fed cover in lowering short-term interest rates within the next month or two.
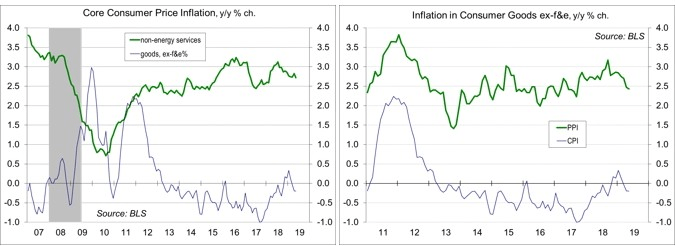
Retail Sales rose 0.5% (reported ± 0.5%) in the advance estimate for May (+3.2% y/y), up 0.5% ex-autos (+3.2% y/y). Figures for March and April were revised higher. Core sales, which exclude motor vehicles, building materials, and gasoline, rose 0.5%, with an upward revision to April (+3.5% y/y).
Industrial Production rose 0.4% in the initial estimate for May (+2.0% y/y), boosted by rebounds in utilities and autos. The output of utilities rose 2.1% (+0.2% y/y), after falling 3.1% in April. Mining output edged up 0.1% (+10.0% y/y). Oil and gas well drilling fell 4.0% (-4.2% y/y), while extraction rose 0.8% (+14.2% y/y). Manufacturing output rose 0.2% (+0.9% y/y), with auto production (which tends to be choppy) up 2.4% (+6.0% y/y). Ex-autos, manufacturing output was flat (+0.3% y/y).
The Consumer Price Index rose 0.1% in May (+1.8% y/y), reflecting lower gasoline prices and a further drop in the prices of used vehicles. Food rose 0.3% (+1.8% y/y), as higher meat prices offset declines in fruits and vegetables. Gasoline (4.2% of the overall CPI) fell 0.5% (+2.4% before seasonal adjustment, and -0.2% y/y). Ex-food & energy, the CPI rose 0.1% (+2.0% y/y). The price index for used motor vehicles fell 1.4%, following a 1.3% decline in April (+0.3% y/y).
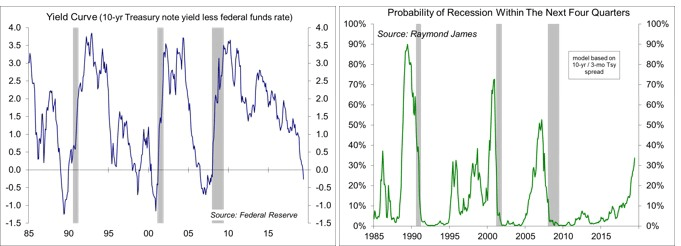
The Producer Price Index edged up 0.1% in May (+1.8% y/y), up 0.4% excluding food, energy, and trade services (+2.3% y/y). Pipeline inflation pressures were mixed, but generally mild. Ex-food & energy, unprocessed intermediate goods fell 8.6% y/y, with processed intermediate goods up 0.3% y/y. These figures do not directly include tariffs, but tariffs may be passed through to some intermediate goods. Intermediate services rose 2.5% y/y.
Import Prices fell 0.3% in May (-1.5% y/y), down 0.2% ex-food & fuels (-1.5% y/y). Prices of industrial supplies and materials ex-fuels fell 1.0% (-4.1% y/y). These figures do not include import duties (tariffs and other taxes).
Business Inventories rose 0.5% in April (+5.3% y/y), while business sales (factory shipments plus wholesale and retail sales) fell 0.2% (+2.8% y/y).
Treasury posted a $207.8 billion Federal Budget Deficit in May, bringing the total for the first eight months of the year to $738.6 billion (a 39% increase over the first eight months of FY18). The deficit over the last 12 months was $985.4 billion. Tax receipts are running 2.3% higher than last year (individual +1.5%, corporate -8.6%, payrolls taxes +4.5%, estate taxes -26.1%, custom duties +80.9%). Outlays are up 9.3% (defense +14.3%, Medicare +22.7%, Social Security +5.7%, interest +15.6%).
The University of Michigan’s Consumer Sentiment Index edged down to 97.9 in mid-June, reflecting concerns about tariffs and slower job growth.
The index of Small Business Optimism rose to 105.0 in May, vs. 103.5 in April (the headline figure set a record of 108.8 in October). Curiously, the report made no mention of tariffs or trade tensions.
The opinions offered by Dr. Brown should be considered a part of your overall decision-making process. For more information about this report – to discuss how this outlook may affect your personal situation and/or to learn how this insight may be incorporated into your investment strategy – please contact your financial advisor or use the convenient Office Locator to find our office(s) nearest you today.
All expressions of opinion reflect the judgment of the Research Department of Raymond James & Associates (RJA) at this date and are subject to change. Information has been obtained from sources considered reliable, but we do not guarantee that the foregoing report is accurate or complete. Other departments of RJA may have information which is not available to the Research Department about companies mentioned in this report. RJA or its affiliates may execute transactions in the securities mentioned in this report which may not be consistent with the report’s conclusions. RJA may perform investment banking or other services for, or solicit investment banking business from, any company mentioned in this report. For institutional clients of the European Economic Area (EEA): This document (and any attachments or exhibits hereto) is intended only for EEA Institutional Clients or others to whom it may lawfully be submitted. There is no assurance that any of the trends mentioned will continue in the future. Past performance is not indicative of future results.


