
One Year On
March 12, 2021
Chief Economist Scott Brown discusses current economic conditions.
The World Health Organization declared the COVID-19 outbreak a pandemic on March 11, 2020. The global economy shut down soon after. In the U.S., consumers and businesses adapted to life under the pandemic, with some disappointing developments and some unexpected changes. As vaccines become more widely available, the end of the pandemic is in sight. The news has been positive, but there may be some challenges from here. The fiscal support package will help to ensure the recovery.
A year ago, we entered an uncertain phase for the economy. Claims for unemployment benefits, which had been trending at a little over 200,000 per week, jumped, rising to 2.9 million (week ending March 21, 2020), then 6.0 million. Unemployment benefits are run by the states (53 separate systems, including the District of Columbia, Puerto Rico, and the U.S. Virgin Islands), leading to mixed results. Most were unable to keep up with the increased volume, leading to repeat filings and distorted totals. Nonfarm payrolls fell by 1.7 million in March of last year, then fell by 20.7 million in April. Job losses were widespread, but concentrated in lower-paying services industries. Leisure and hospitality jobs were cut nearly in half. The speed and magnitude of job losses were unprecedented.
In April, the fear was that massive job losses would feed through to even broader economic weakness. In a chain reaction, businesses could have defensively reduced payrolls, and in turn, weak economic expectations would become self-fulfilling. We’re lucky 2020 was an election year. Lawmakers reached bipartisan agreement on the Coronavirus Aid, Relief, and Economic Security (Cares) Act, which provided $2.2 trillion in fiscal stimulus. The eligibility for unemployment benefits was expanded to include the self-employed, part-time workers, and those who had previously exhausted their benefits. In addition, the federal government supplemented state benefits.
Businesses adopted procedures to deal with the virus, including the screening of workers and elevating levels of cleaning. White collar workers were more able to work from home. Consumers bought goods online, had food delivered, and watched movies at home.
Unable to spend on consumer services, people spent more on things. Fiscal support, in the form of checks and direct deposits, and extended unemployment benefits added fuel. Sales of motor vehicles, boats, and RVs picked up. Spending on home improvement jumped. A lot of holiday shopping is traditionally done in person and spending in November and December was disappointing, but in January, consumer spending on durable goods (cars, furniture, etc.) was 18.6% higher than a year earlier. However, spending on services, which is much larger than spending on durable goods, was still down 5.3% year-over-year.
If you can work from home, you can work from just about anywhere. We saw increased demand for larger homes, in better locations, and mortgage rates were at generational lows. The supply of new and existing homes has remained a constraint and the combination lead to sharp increases in home prices.
Congress passed another $900 billion in fiscal support in late 2020 (which seems to have contributed to the strong January spending). Last week, Congress passed and the president signed the $1.9 trillion American Relief Plan Act, which extends the $300 unemployment benefit supplement to Labor Day, provides another $1,400 in direct payments, and expands the child tax credit (among many other elements). The key point is it provides more support to lower-income households, which are more likely to spend that support.
As vaccines become more widely available and the economy opens up, we should see a rapid increase in spending on services. One lesson from the 1918 pandemic is that people will be eager to make up for lost time (as we saw during the Roaring Twenties). Spending on consumer durables may moderate a bit.
One difficulty in the next phase of the recovery may be matching unemployed workers with jobs. There is always a certain about of friction in the job market. That level of friction should be magnified in the current environment. Some jobs are unlikely to come back. For example, we may not need as many food and transportation support jobs in big cities. Things should work out over time. The great success of the American economy is that we constantly reinvent ourselves over time. Two hundred years ago, most were in agriculture. In the 1950, nearly a third of jobs were in manufacturing. It’s difficult to say what the future has in store, but there is a lot to be optimistic about right now.
Recent Economic Data
The Consumer Price Index rose 0.4% in February (+1.7% y/y). Food rose 0.2% (+3.6% y/y). Retail gasoline prices rose 6.4% (+1.5% y/y). Ex-food & energy, the CPI rose 0.1% (+1.3% y/y). Homeowners’ equivalent rent (24% of the overall CPI and 30% of the core CPI) rose 0.3% (vs. +0.1% in each of the three previous months), up 2.0% over the last 12 months, vs. 3.3% in the 12 months before that.
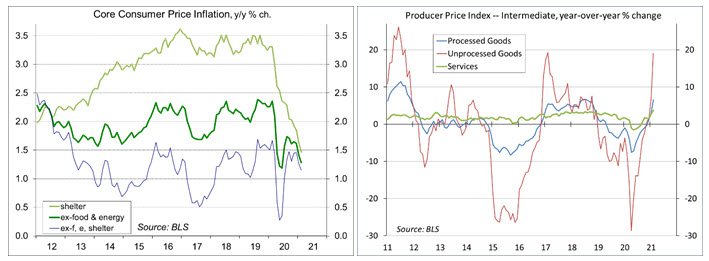
The Producer Price Index rose 0.5% in February (+2.8% y/y). Food rose 1.3% (+4.5% y/y), partly reflecting the impact of bad weather. Wholesale gasoline prices rose 13.1% (+9.2% before seasonal adjustment, +3.5% y/y), following +13.5% in December and +13.6% in January. Ex-food, energy, and trade services, the PPI rose 0.2% (+2.2% y/y). Ex-food & energy, the index for intermediate unprocessed goods rose 25.2% year-over-year, while intermediate processed goods rose 5.8%. However, it takes a huge increase in the prices of raw materials to have even a tiny impact at the consumer level.
Inflation compensation (the yield difference between inflation-adjusted and fixed-rate Treasuries) rose to 2.5% for the five-year horizon, but remained near 2% for the five-year period after that.
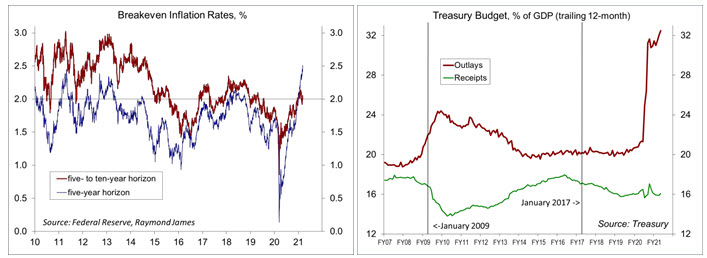
Treasury reported a $311 billion deficit for February, bringing the total for the first five months of the fiscal year to $1.047 trillion (also $3.554 trillion over the last 12 months, or about 16.4% of GDP). For the first five months of FY21, tax receipts are up 5.1%, while outlays rose 24.7%.
Gauging the Recovery
The number of new daily COVID-19 cases appears to have stabilized following a sharp decline from a highly elevated level in early January. The drop has led to a relaxation in social distancing directives, which should help the economy into 2Q21. The number of U.S. deaths from the coronavirus has surpassed 527,000.
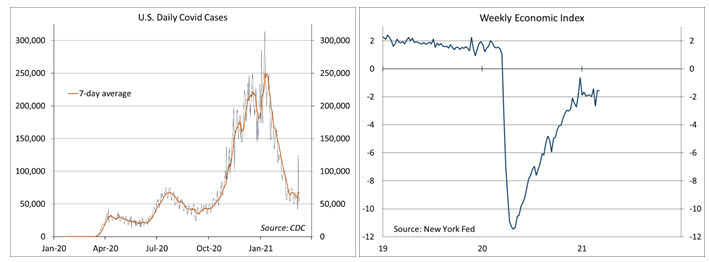
The New York Fed’s Weekly Economic Index was little changed at -1.57% for the week ending March 6, down from -1.55% a week earlier (revised from -2.28%) and a low of -11.45% at the end of April. The WEI is scaled to four-quarter GDP growth (for example, if the WEI reads -2% and the current level of the WEI persists for an entire quarter, we would expect, on average, GDP that quarter to be 2% lower than a year previously).
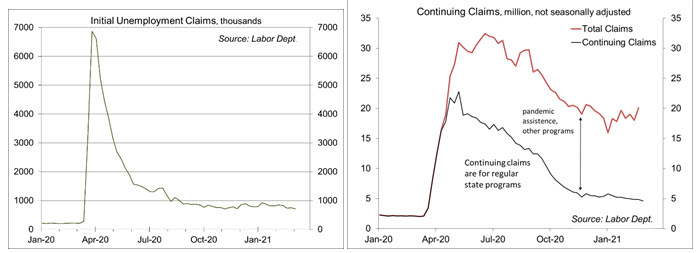
Jobless claims fell by 45,000, to 712,000, in the week ending March 6 (709,458 before seasonal adjustment), still very high by historical standards. Claims totaled 7.62 million over the first nine weeks of the year.
The University of Michigan’s Consumer Sentiment Index rose to 83.0 (a 12-month high) in the mid-month assessment for March (the survey covered February 24 to March 10), vs. 76.8 in February and 79.0 in January. The report noted gains from the improved vaccine outlook and the prospects for the fiscal stimulus package. However, while respondents were more optimistic about the U.S. economic outlook, judgements of their own personal financial situation were little changed.
The opinions offered by Dr. Brown are provided as of the date above and subject to change. For more information about this report – to discuss how this outlook may affect your personal situation and/or to learn how this insight may be incorporated into your investment strategy – please contact your financial advisor or use the convenient Office Locator to find our office(s) nearest you today.
This material is being provided for informational purposes only. Any information should not be deemed a recommendation to buy, hold or sell any security. Certain information has been obtained from third-party sources we consider reliable, but we do not guarantee that such information is accurate or complete. This report is not a complete description of the securities, markets, or developments referred to in this material and does not include all available data necessary for making an investment decision. Prior to making an investment decision, please consult with your financial advisor about your individual situation. Investing involves risk and you may incur a profit or loss regardless of strategy selected. There is no guarantee that the statements, opinions or forecasts provided herein will prove to be correct.