Reading the Data
Economic data releases that were delayed due to the partial government shutdown, including fourth quarter Gross Domestic Product, have been rolling in. These reports may seem a bit dated, and the figures are subject to revision, but the hope is that, combined with fresher figures for January and February, they may help to gauge the strength of the economy over the next few quarters.
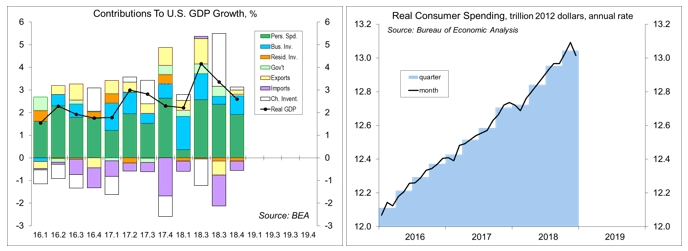
Real GDP rose at a 2.6% annual rate in the “initial” estimate for 4Q18. In terms of the available component data, this report falls somewhere between the usual “advance” and “2nd” estimates. Consumer spending rose a bit more than anticipated, although monthly figures showed an unusual drop in December. Much of the December weakness was in motor vehicles and energy (lower prices and lower consumption). Income rose sharply in December, reflecting farm subsidies and increased dividends. The Bureau of Economic Analysis also released income figures for January, which showed a reversal in farm income and dividends. Wage and salary growth was moderately strong in December, although somewhat slower in January – and should continue to provide support for consumer spending growth over the near term.
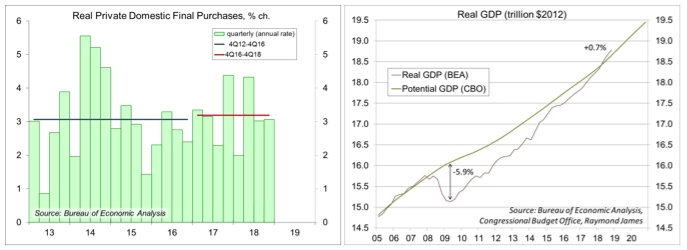
Inventories and foreign trade are relatively small portions of GDP, but they account for more than their fair share of volatility in GDP growth. Inventories rose at a faster pace in 3Q18, adding 2.3 percentage points to GDP growth. Contrary to expectations, the pace of inventory growth remained elevated in 4Q18, adding 0.1 percentage point (recall the change in inventories contributes to the level of GDP growth and the change in the change in inventories contributes to GDP growth – in other words, faster inventory accumulation adds to GDP growth, slower inventory accumulation subtracts). Net exports (a wider trade deficit) subtracted 2.0 percentage points from GDP growth in 3Q18, and the trade balance widened a little more in 4Q18, subtracting 0.2 percentage point from GDP growth. Private Domestic Final Purchases (PDFP) is GDP less net exports and the change in inventories. PDFP, a measure of underlying domestic demand, rose at a 3.1% annual rate in 4Q18 (also up 3.1% y/y).
The level of GDP now exceeds the Congressional Budget Office’s estimate of potential GDP (the rate consistent with a steady unemployment rate and stable inflation). Estimates of potential GDP are imprecise, but taken at face value, the recent data suggest that the economy has moved beyond full employment. Last year, a number of Fed officials thought it might be appropriate to move the federal funds rate above a neutral level to lead GDP back to its potential. Needless to say, the moderate inflation trend and the uncertainties surrounding the estimate of potential GDP suggest that the Fed can be patient in deciding the next move.
In his monetary policy testimony to Congress, Fed Chairman Powell covered no new ground. However, there were a couple of minor items that are worth emphasizing. The first was the notion of labor market slack. Powell pointed to individuals on the sidelines, not considered “unemployed,” who could re-enter the workforce. That helps to explain the relatively limited upward pressure on wages in the last couple of years. The other issue Powell mentioned was the upcoming demand on its monetary policy framework. The Fed has consistently undershot its 2% goal on inflation in recent years, and financial market participants have come to see 2% as more of a ceiling on inflation than a goal. It’s possible that the Fed will shift from inflation targeting to a price level targeting system. Equivalently, that means that the Fed would work toward an average inflation rate of 2%. If inflation falls below the 2% goal for a while, then the Fed would try for a period of inflation above 2%. This is likely to be controversial. The Fed will conduct town hall conferences and academic seminars as it discusses possible changes. However, the end result of a shift to price level targeting would be that the Fed would be a little less likely to raise short-term interest rates. Factor in Powell’s comments on labor market slack, and the central bank isn’t expected to raise short-term interest rates anytime soon. Of course monetary policy decisions will remain data-dependent, and the Fed could tighten if conditions warrant, but that doesn’t seem likely from where things stand now.
For those used to observing the Fed closely, January’s shift to a neutral policy stance (from a mild tightening bias in mid-December) and the decision to cut short the unwinding of the balance sheet (expected later this year) seem relatively slight. Neither of these represent a sea change in the monetary policy outlook. However, the financial markets have reacted sharply to minor changes in Fed policy perceptions. Now, with the Fed on hold and economic growth likely to remain moderate, what will drive the financial markets?
Data Recap – The initial estimate of real GDP growth was somewhat stronger than expected, but with mixed components and a number of anomalies. On balance, recent data are consistent with a moderate pace of economic growth in the near term.
In his monetary policy testimony to Congress, Fed Chairman Powell did not surprise. The Fed saw “cross currents and conflicting signals” at the start of the year and “financial conditions are now less supportive of growth than they were earlier last year.” At the policy meeting in late January, “with inflation pressures muted, the FOMC determined that the cumulative effects of these developments, along with ongoing government policy uncertainty, warranted taking a patient approach with regard to future policy changes.” The size of the Fed’s balance sheet “will be determined by the demand for Federal Reserve liabilities such as currency and bank reserves,” and a decision on the timing will likely be made soon.
Real GDP rose at a 2.6% annual rate in the “initial” estimate for 4Q18 (+3.1% y/y). Private Domestic Final Purchases (GDP less next exports and the change in inventories), a better, more stable measure of underlying domestic demand, rose at a 3.1% annual rate (+3.1% y/y). Consumer spending rose at a 2.8% pace (+2.7% y/y), a bit better than anticipated. Business fixed investment rose 6.2% (+7.2% y/y), mixed across sectors (structures -4.2%, computers and info-processing equipment -17.6%, transportation equipment +17.0%, software +14.5%, research and development +13.5%). Residential fixed investment fell at a 3.5% annual rate (-3.0% y/y). Inventory growth, which had picked up sharply in 3Q18, rose even faster in 4Q18, adding 0.1 percentage point to GDP growth. Net exports (a wider trade deficit) subtracted 0.2 percentage point from GDP growth.
Personal Income rose 1.0% in the initial estimate for December (+5.0% y/y), boosted by farm subsidies and dividends (ex-farm income and dividends, personal income rose 0.4%). The Bureau of Economic also reported personal income figures for January (down 0.1%, reflecting a rollback in farm subsidies and dividends). Private-sector wages and salaries rose 0.5% in December and 0.3% in January (+4.4% y/y). Personal Spending fell 0.5 (+4.0% y/y), with weakness in autos (-1.1%) and energy goods and services (-7.8%) – ex-autos and energy, spending fell 0.2%. Adjusted for inflation, spending fell 0.6% (+2.2% y/y). The PCE Price Index rose 0.1% (+1.7% y/y), up 0.2% ex-food & energy (+1.9% y/y).
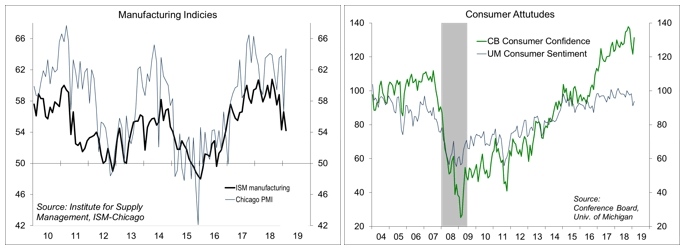
The ISM Manufacturing Index slipped to 54.2 in February, vs. 56.6 in January and 54.3 in December. New orders and production grew at a moderate pace (although somewhat more slowly than in January). Employment growth was slower. Input price pressures remained slightly below the breakeven level. Supply managers generally noted relative strength near term, but continued to express caution about the future.
The Chicago Business Barometer (which covers firms in Illinois and Northern Indiana) jumped to 64.7 in February, vs. 56.7 in January and 63.8 in December.
The Conference Board’s Consumer Confidence Index rose to 131.4 in the advance estimate for February (based on information collected on or before February 15), vs. 121.7 in January and 126.6 in December (it hit an 18-year high of 137.9 in October). Expectations rebounded, reflecting increased optimism regarding future business conditions and household income. Expectations of future job availability turned back to optimistic. Current job market perceptions remained very strong.
The University of Michigan’s Consumer Sentiment Index was 93.8 in the full-month reading for February, down from 95.5 at mid-month, but up from 91.2 in January as “the bounce-back from the end of the Federal shutdown faded.” The report noted that “consumers continued to react to the Fed’s pause in raising interest rates, balancing the favorable impact on borrowing costs against the negative message that the economy at present could not withstand another rate hike.”
Factory Orders rose 0.1% in December, as a 28.4% rebound in civilian aircraft orders was offset by a 1.0% decline in orders for nondurables (weaker petroleum prices). Orders for nondefense capital goods ex-aircraft fell 1.0% (revised from -0.7% reported earlier), following a 1.1% drop in November, up just 2.0% y/y.
Building Permits edged up 0.3% in December (+0.5% y/y), reflecting the usual volatility in the multi-family sector. Single-family permits, the key information in the report, fell 2.2% (-5.5% y/y), mixed across regions (-20.3% in the Northeast, -14.2% in the Midwest, +2.2% in the South, and -18.5% in the West). Housing Starts plunged 11.2% (-10.9% y/y), also reflecting volatility in multi-family, although single-family starts fell 6.7% (-10.5% y/y).
The Pending Home Sales Index rebounded 4.6% in January (-2.3% y/y), reflecting lower mortgage rates.
The Chicago Fed National Activity Index, a composite of 85 economic indicators, fell to 0.00 in the initial estimate for January. At 0.09, the three-month average was consistent with slower economic growth (near the long-term trend) in the near term.
This Week – Some delayed data (new home sales, trade balance) arrive, but the focus will likely be on the February employment figures. January payroll growth seemed suspiciously strong, possibly exaggerated by the seasonal adjustment. The trend (three-month average) in job growth should remain moderately strong, with continued upward pressure in wages.
The opinions offered by Dr. Brown should be considered a part of your overall decision-making process. For more information about this report – to discuss how this outlook may affect your personal situation and/or to learn how this insight may be incorporated into your investment strategy – please contact your financial advisor or use the convenient Office Locator to find our office(s) nearest you today.
All expressions of opinion reflect the judgment of the Research Department of Raymond James & Associates (RJA) at this date and are subject to change. Information has been obtained from sources considered reliable, but we do not guarantee that the foregoing report is accurate or complete. Other departments of RJA may have information which is not available to the Research Department about companies mentioned in this report. RJA or its affiliates may execute transactions in the securities mentioned in this report which may not be consistent with the report’s conclusions. RJA may perform investment banking or other services for, or solicit investment banking business from, any company mentioned in this report. For institutional clients of the European Economic Area (EEA): This document (and any attachments or exhibits hereto) is intended only for EEA Institutional Clients or others to whom it may lawfully be submitted. There is no assurance that any of the trends mentioned will continue in the future. Past performance is not indicative of future results.


