Sacagawea?!
Sacagawea lived from May 1788 to December 1812. She was a Lemhi Shoshone woman who is best known for her help guiding the Lewis and Clark Expedition in achieving their mission objectives by exploring thousands of miles from North Dakota to the Pacific Ocean. She helped establish cultural contacts with the Native American populations in addition to her contributions to natural history. She was inducted into the National Women’s Hall of Fame in 2003.
So Sacagawea guided folks through “dangerous waters.” Similarly, that’s kind of how I feel in that I attempt to “guide” folks, not necessarily through “dangerous waters,” but certainly through some difficult times. Obviously if you make a call sometimes you get it wrong, but as often stated, “When you are wrong you say you are wrong quickly for a de mimimis loss of capital.” Most recently, my indicators had been “long” from said December “lows,” actually looked for an “energy peak” in mid-February and for a small pullback from there. That energy peak never showed up and I adjusted my strategy accordingly looking for higher prices. I still feel that way. Indeed, last year that guiding task was pretty difficult, but since the October 2, 2018 “sell signal,” and the subsequent selling climax low in late December, the guiding task has been fairly simple.
Last week the S&P 500 (SPX/2803.69) gained 0.39% and has now traveled into the 2800 – 2820 overhead resistance zone. Participants will now focus on the November 7, 2019 intraday reaction high of 2800.18, as well as the December 3, 2018 intraday reaction high of 2815.15. Just as they didn’t think the SPX would trade above its 50-day moving average (DMA currently at 2749.63), or its 200-DMA (now at 2649.63), we think the December high will eventually be eclipsed just like the November high “fell” last week. Pointing the way higher, the S&P Mid-Cap Index bettered its 200-DMA, as well as its December 3, and November 7, 2018 recovery highs.
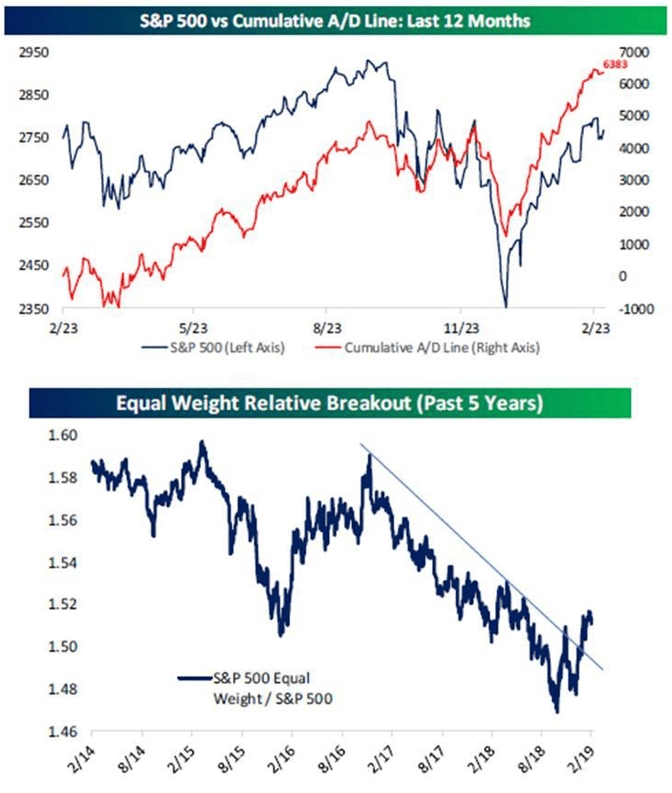
On the negative side it is worth noting, however, that the SPX is ~2% above its 200-DMA and 6.1% above its 50-DMA. Also noteworthy is that Upside Volume has been falling, new highs over new lows has also been falling, and the stock market remains overbought on a short-term basis. On the positive side, the Volatility Index (VIX/13.57) has fallen noticeably. Yet the most bullish indicator out there is the Advance-Decline Line, which traded to new all-time highs last week. As the brainy Leon Tuey writes (as paraphrased):
They keep babbling about the S&P 500 index, not knowing the difference between an Index and “the market.” They obviously don’t understand the market’s logic. . . . It is not the indices that are the markets. The Advance-Decline is “The” market and it has traded out to a new all-time high.
Our pals at the eagle-eyed Bespoke Investment Group also chimed in over the weekend about the A/D line by writing:
While the S&P 500 has not made it back to its September all-time high yet, the cumulative advance/decline line, which is a running tally of the daily number of advancers minus decliners, has blown past the prior highs. This type of strength in breadth suggest that price will soon follow, giving bulls a supporting argument that new highs will be made during this rally. The spread between the S&P 500 equal-weighted index and the normal cap-weighted index also highlights the strength in breadth recently. As shown, the equal-weighted index underperformed in 2017 and 2018, but it has broken out of its downtrend during the post-Christmas Eve rally (see chart 1).
Interestingly, as of February 25, 2019 the Operating Company Only A/D Line, which excludes closed-end funds, bond funds, etc., also traded to a new all-time high; and, it is not just the S&P 500 A/D line, but the mid-cap and small-cap indices as well. As the astute Lowry Research organization writes:
Both the NYSE all-issues and Lowry’s OCO Advance-Decline Line continue to lead gains in the major price indexes, with each Advance-Decline Line reaching new all-time highs. In the last decade, this observed lead of breadth over price, when preceded by a drawdown of 10% or more, has solidified the new intermediate term rally and precipitated fresh all-time highs in the price indexes (Aug. 2010, Jan, 2012, Apr. 2016, and Apr. 2018).
Leon Tuey concludes:
It’s not the end of the world as the secular bull market which began on October 10, 2008, remains intact. As mentioned, the second leg of the bull market which commenced in February, 2016, is the longest and strongest as it is driven by improving economic conditions as a result of monetary easing. Since the first leg lasted nearly seven years, the current leg is still early and still has some ways to go in terms of time and distance. Hence, when the short-term overbought condition is rectified, re-deploy cash.
Meanwhile, the Supply Line (read: sellers) remains in a downtrend while the Demand Line, as measured by the Buying Power Index, is near its high recorded at the September SPX all-time high. This is not the type of action seen at the end of a secular bull market. Again as Leon writes:
Typically, at the top of a bull market, investors are heavily invested in equities and hold little cash. At major bear market bottoms, they are flushed with cash and hold little equities. Today, big and small, investors are sitting on a mountain of cash and have little equities. As mentioned in my recent report, about $8 trillion (not million or billion, but trillion) are sitting in bank deposits and over $1 trillion in brokers’ accounts. I don’t believe there is another time in history, so much cash is sitting idle. Not all that cash will come pouring back into the market, of course, but it does represent huge potential demand. The cynics will say that these investors will never come back. Clearly, they have no understanding of human nature. The pigeons always come back.
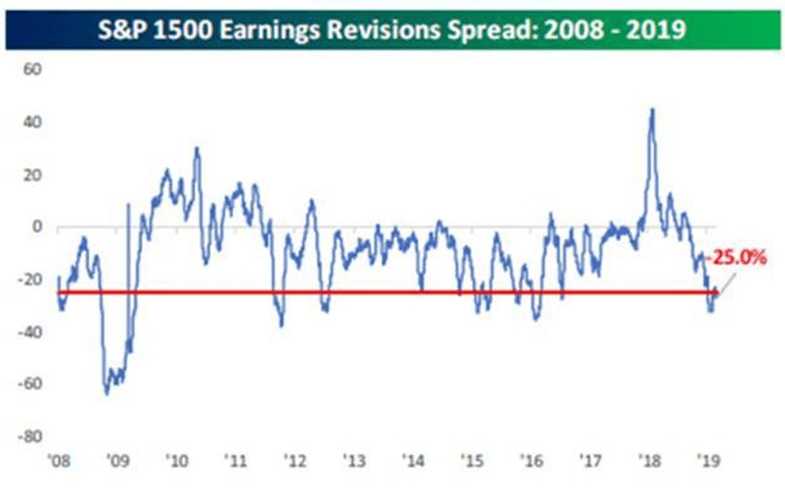
Unsurprisingly, as I have observed over nearly five decades in this business, when stocks go up analysts increase their earnings estimates, but when stocks go down they tend to cut those estimates. Recently, analysts have been cutting earnings estimates at a much faster rate than they are raising them (chart 2). However, those companies not reducing EPS estimates, with positive ratings from our fundamental analysts, and that screen positive under my indicators, for your potential buy lists, include: Boston Scientific (BSX/$40.75/Strong Buy), Salesforce (CRM/$164.53/Strong Buy), Cisco (CSCO/$51.41/Outperform), Roper (ROP/$323.63/Outperform), Estee Lauder (EL/$156.92/Outperform), and Oracle (ORCL/$52.51/Outperform).
The call for this week: While I do not put much weight on it, there was a short-term traders’ sell signal late last week when the 14-day Stochastic Indicator crossed below its moving average. It is hard to argue with the strength of this market and our indicators suggest two more weeks of upside pressure with very small pullbacks, if at all. What I expect is a long steady upside grind higher. In the presentations I gave last week to individual investors, the sentiment remains not just cautious, but they are scared to death. Again, according to Bespoke:
2019 has seen one of the best starts to a year on record for the S&P 500. Through late February, the S&P had been up on 73% of trading days. The 7 prior years that saw similar strength saw gains for the remainder of the year every time (chart 3).
And then there was this again from Bespoke (March 2, 2019):
As long as the Nasdaq doesn’t finish down five points or more today (it’s currently indicated up by 50), this will be the tenth straight positive week for the index. The last time that happened was nearly two decades ago in 1999! Below are all of the ten-week winning streaks for the Nasdaq as well as its performance following the tenth straight up week. Interestingly enough, of the eight prior ten week streaks, six went to eleven or more. As shown, the average performance the week after the 10th straight positive week was a gain of 1.07% (median: 1.58). Even more impressive is the fact that three months later the Nasdaq was up every time for an average gain of over 10%! Looking further out, six-month and one-year returns are a little more muted, but the only time the Nasdaq was down one year later was after the last streak in 1999 when it fell more than 36%!
This morning the preopening futures are better by some 10-points as we write at 4:55 a.m. on rumors a U.S. China trade is very close to happening.
Additional information is available on request. This document may not be reprinted without permission.
Raymond James & Associates may make a market in stocks mentioned in this report and may have managed/co-managed a public/follow-on offering of these shares or otherwise provided investment banking services to companies mentioned in this report in the past three years.
RJ&A or its officers, employees, or affiliates may 1) currently own shares, options, rights or warrants and/or 2) execute transactions in the securities mentioned in this report that may or may not be consistent with this report’s conclusions.
The opinions offered by Mr. Saut should be considered a part of your overall decision-making process. For more information about this report – to discuss how this outlook may affect your personal situation and/or to learn how this insight may be incorporated into your investment strategy – please contact your Raymond James Financial Advisor.
All expressions of opinion reflect the judgment of the Equity Research Department of Raymond James & Associates at this time and are subject to change. Information has been obtained from sources considered reliable, but we do not guarantee that the material presented is accurate or that it provides a complete description of the securities, markets or developments mentioned. Other Raymond James departments may have information that is not available to the Equity Research Department about companies mentioned. We may, from time to time, have a position in the securities mentioned and may execute transactions that may not be consistent with this presentation’s conclusions. We may perform investment banking or other services for, or solicit investment banking business from, any company mentioned. Investments mentioned are subject to availability and market conditions. All yields represent past performance and may not be indicative of future results. Raymond James & Associates, Raymond James Financial Services and Raymond James Ltd. are wholly-owned subsidiaries of Raymond James Financial.
International securities involve additional risks such as currency fluctuations, differing financial accounting standards, and possible political and economic instability. These risks are greater in emerging markets.
Investors should consider the investment objectives, risks, and charges and expenses of mutual funds carefully before investing. The prospectus contains this and other information about mutual funds. The prospectus is available from your financial advisor and should be read carefully before investing.


