Tax Time
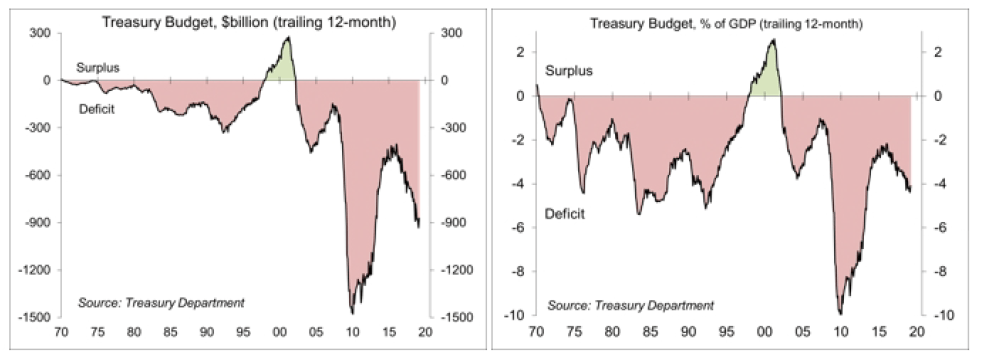
Tax Time – The Treasury Department reported that the federal deficit totaled $691 billion for the first half of FY19, up from $600 billion for the first half of FY18. The full-year deficit (ending in September) is expected to hit $1 trillion.
Tax receipts were up 0.7% in the first six months of FY19. Individual tax receipts were down 1.7%. Corporate tax revenues fell 13.5%. Payrolls taxes rose 4.7%
Federal outlays rose 4.9% y/y. Defense rose 13.6%. Medicare rose 3.3%. Social Security payments were up 5.6%. Interest on the debt rose 14.8%. Spending on everything else fell 2.9%.
When talking about the budget, the dollar levels can be intimidating. It’s best to look at the figures as a percentage of GDP. The deficit hit 10% of GDP in the early part of the Great Recession. That reflected the magnitude of the downturn. Tax receipts dried up and recession-related spending (food stamps, unemployment benefits) rose. President Obama had requested, and Congress approved, a large stimulus package in 2009, which partly added to the total, but that was temporary. As the economy recovered, the deficit fell.
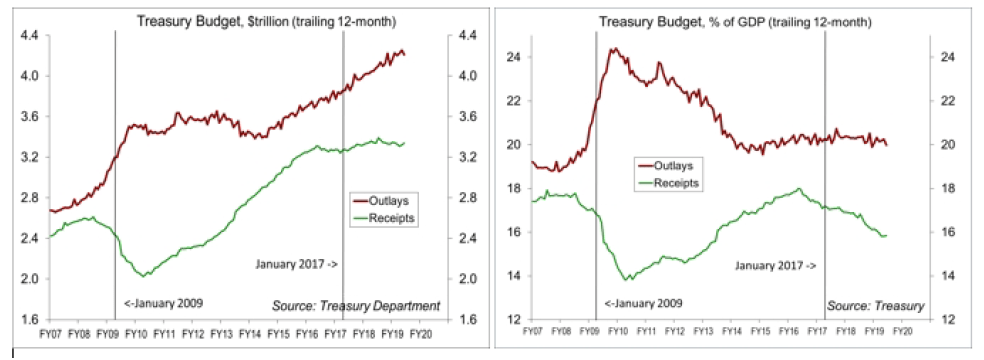
In the last few years, revenues have trended about flat, while outlays have continued to trend higher. However, as a percentage of GDP, outlays have trended roughly flat, while tax receipts have declined.
The Tax Cut and Jobs Act of 2017 (TCJA) lowered the capital gains tax rate 35% to 21%. The bill also allowed for a one-time repatriation tax on profits of overseas subsidiaries. For individuals, the TCJA altered tax brackets, lowered tax rates, increased standard deductions, and raised family tax credits, but it also reduced itemized deductions and personal exemptions. The deduction for state and local income taxes, sales taxes, and property taxes was capped at $10,000.
While proponents of the plan suggested that the corporate tax cut would significantly boost capital spending, others argued that firms were generally flush with cash and borrowing costs were low – if they weren’t expanding in that environment, why would giving these firms more cash change their behavior? The academic literature showed that corporate tax cuts would be more likely to show through as increased dividends and share buybacks, which was definitely the case in 2018. For individuals, the impact of the TCJA was unclear. The limitation on deductions was expected to penalize those in high-tax states. As this tax season has progressed, tax refunds have been a bit smaller than a year ago (fewer returns and a lower average return). However, higher-income household tend to file later. Many of middle class households that usually receive a refund may find that they owe. However, many of those at the upper end of the income scale will find that they will get a nice refund instead. As a consequence, consumer spending at the lower end of the income scale may be a bit tighter this year. Upper income households tend to be savers, so we may not see much of a boost to spending from tax changes, but the extra after-tax income is likely to support share prices into the summer months.
Proponents of the TCJA expected the tax holiday on foreign profits to bring about $2 trillion home to the U.S. Instead, we got about a quarter of that. That’s partly because a lot of overseas profit is a tax dodge. Brad Setser, a senior fellow at the Council on Foreign Relations, asks “Why would any multinational corporation pay America’s 21% tax rate when it could pay the new ‘global minimum’ rate of 10.5% on profits shifted to tax havens, particularly when there are few restrictions on how money can be moved around a company and its foreign subsidiaries?” Foreign earnings account for nearly 40% of earnings of the S&P 500. However, “earnings” from seven low-tax nations (Netherlands, Ireland, Bermuda, Luxembourg, Switzerland, British Caribbean, and Singapore) far exceed earnings from the major economies of the world (Europe, China, etc.). Companies can (and do) issue debt backed by these overseas earnings, further reducing their U.S. tax obligations. The way to address this issue is through a coordinated international agreement, which is unlikely to happen anytime soon.
Meanwhile, as we move gradually to the election in 2020, we can expect to hear a lot from Republicans on the need to “rein in federal spending,” most likely through entitlement reform, while the Democrats are likely to call for corporations and the wealthy to “pay their fair share.” Is this a great country or what?
Data Recap – Brexit got kicked down the road, prolonging uncertainty, and the IMF cautioned about the global growth outlook. However, Chinese exports rebounded in March (after falling sharply in February) — that’s almost certainly related to the Chinese New Year holiday, but investors don’t care because it was “risk on.” Excluding energy, March inflation numbers were benign. FOMC minutes and Fedspeak added to the view the short-term interest rates are on hold.
The European Union agreed to delay Brexit (the United Kingdom’s exit from the EU) until October 31. The EU also indicated that it would impose tariffs on $12 billion of U.S. exports, citing subsidies to Boeing. President Trump said he would impose tariffs on $11 billion of EU exports, citing the World Trade Organization’s ruling that that EU subsidies to Airbus had adversely effected the U.S.
The FOMC Minutes for the March 19-20 policy meeting showed that officials generally lower their growth estimates due to “disappointing news on global growth and less of a boost from fiscal policy than had previously been anticipated.” In considering the future course of monetary policy, “a majority of participants expected that the evolution of the economic outlook and risks to the outlook would likely warrant leaving the target range unchanged for the remainder of the year.” Moreover, “several participants noted that their views of the appropriate target range for the federal funds rate could shift in either direction based on incoming data and other developments.”
Fed Vice Chairman Clarida spoke on this year’s review of the monetary policy framework, where the central bank will review is strategies, tools, and communications policies, with possible change being implemented in 2020. In a separate speech on the economic outlook and monetary policy, Clarida noted signs that “U.S. economic growth is slowing somewhat from 2018’s robust pace,” adding that “we have indicated we can be patient as we assess what adjustments, if any, will be appropriate to the stance of monetary policy.” The Fed will conduct town hall seminars on the monetary policy framework and an academic conference is scheduled at the Chicago Fed on June 4-5.
In its revised World Economic Outlook, the IMF lowered its estimate of global growth in 2019 to 3.3% after having lowered its estimate in January. The IMF said that the global economic expansion has “lost steam.” A pickup in growth is anticipated in 2020. However, the risks to the global growth outlook re “skewed to the downside.”
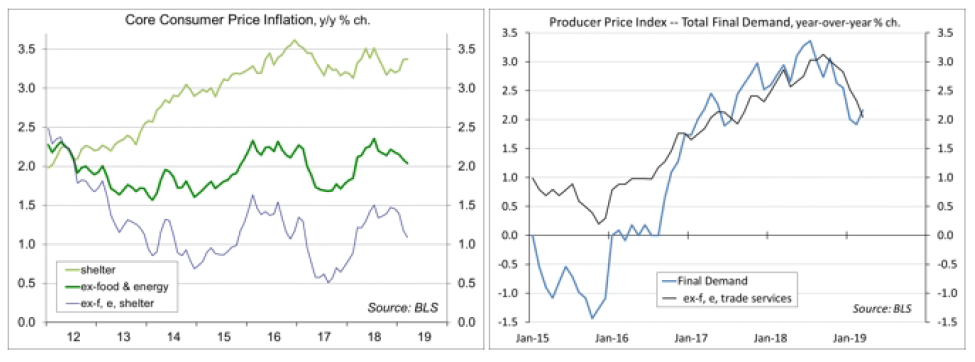
The Consumer Price Index rose 0.4% in March (+1.9% y/y). Food rose 0.3% (+2.1% y/y). Energy rose 3.5% (-0.4% y/y), led by a 6.5% increase in gasoline (-0.7% y/y). Excluding food & energy, the CPI rose 0.1% (+2.0% y/y), held down by a 1.9% drop in apparel (-2.2% y/y), which may reflect seasonal adjustment difficulties due to the late Easter). Shelter cost rose 0.4% (+3.4% y/y).
Real Hourly Earnings fell 0.3% in March (+1.3% y/y), down 0.2% for production workers (+1.6% y/y).
The Producer Price Index rose 0.6% in March (+2.2% y/y), reflecting a 16.0% increase in gasoline prices (-4.3% y/y) and a 1.1% increase in trade services (+3.9% y/y, most of the March increase was in retailer margins). Ex-food, energy, and trade services, the PPI was flat (+2.0% y/y). Pipeline inflation pressures were mixed, but generally mild. Ex-food & energy, unprocessed intermediate goods fell 2.9% y/y, with processed intermediate goods up 1.6% y/y. These figures do not directly include tariffs, but tariffs may be passed through to some intermediate goods. Intermediate services rose 2.6% y/y
Import Prices rose 0.6% in the initial estimate for March (0.0% y/y), boosted by higher energy costs (petroleum up 4.7%, natural gas up 42.3%). Ex-food & fuels, import prices fell 0.2% (-0.7% y/y). Ex-fuels, prices of imported industrial supplies and materials slipped 0.1% (-1.7% y/y). These figures do not include tariffs.
Initial Claims for unemployment benefits fell to 196,000 for the week ending April 6 – the lowest since October 4, 1969. The four-week average dipped to 207,000. Figures are subject to seasonal adjustment noise due to the late Easter this year. There has been a growing gap between jobless claims and actual layoffs, which may be due eligibility issues or it could reflect the strength of the job market (that is, those laid off are likely to find a new job sooner).
Factory Orders fell 0.5% in February, reflecting a 31.1% drop in civilian aircraft orders. %). Durable goods orders were unrevised (at -1.6%). Orders for nondurables rose 0.6% (likely reflecting higher petroleum prices). Results were mixed across industries. Orders for nondefense capital goods ex-aircraft fell 0.1% (unrevised) – down 1.4% since July.
The University of Michigan’s Consumer Sentiment Index edged down to 96.9 in the mid-April reading, vs. 98.4 in March and 93.8 in February. The impact of tax cut legislation on sentiment “appears to have run its course” (that is, consumers were no longer mentioning it). Income growth and low inflation were the more important driver of sentiment, but the impact of real income growth has been thwarted by higher prices of homes and autos.The Index of Small Business Optimism was essentially unchanged in March (101.8, vs. February’s 101.7).
The European Central Bank’s Governing Council left short-term interest rates unchanged. ECB President Draghi said that recent information “confirms slower growth momentum extending into the current year” and “global headwinds continue to weigh on euro area growth developments.”
The opinions offered by Dr. Brown should be considered a part of your overall decision-making process. For more information about this report – to discuss how this outlook may affect your personal situation and/or to learn how this insight may be incorporated into your investment strategy – please contact your financial advisor or use the convenient Office Locator to find our office(s) nearest you today.
All expressions of opinion reflect the judgment of the Research Department of Raymond James & Associates (RJA) at this date and are subject to change. Information has been obtained from sources considered reliable, but we do not guarantee that the foregoing report is accurate or complete. Other departments of RJA may have information which is not available to the Research Department about companies mentioned in this report. RJA or its affiliates may execute transactions in the securities mentioned in this report which may not be consistent with the report’s conclusions. RJA may perform investment banking or other services for, or solicit investment banking business from, any company mentioned in this report. For institutional clients of the European Economic Area (EEA): This document (and any attachments or exhibits hereto) is intended only for EEA Institutional Clients or others to whom it may lawfully be submitted. There is no assurance that any of the trends mentioned will continue in the future. Past performance is not indicative of future results.


