
The October Employment Report
Chief Economist Scott Brown discusses current economic conditions.
Nonfarm payrolls rose more than expected last month, despite being held back by the strike at General Motors (which subtracted 42,000) and the exit of 20,000 temporary workers for the 2020 census. There is some uncertainty in these data. The birth/death model, which attempts to account for the impact of business creation and destruction, added 274,000 to the unadjusted payroll figure (about the same as in October 2018). The birth/death model does a good job, except at turning points. This is probably not a turning point, but you won’t know until after the fact. Demographic changes (an aging population and slower growth in the workforce) imply that payroll growth ought to be slowing down. However, it’s unclear how much slack is still available in the labor market – a key question for Fed policymakers.
Nonfarm payrolls rose by 128,000 in the initial estimate for October, with a net +95,000 revision to figures for August and September. The GM strike subtracted 42,000 (these workers will return to the nonfarm payroll total in November). Preliminary work for the 2020 census led to a 25,000 increase in government workers in August. With much of that work done, most of these jobs disappeared in October. The census will play a big part in the payroll figures next year. In the last two censuses, temporary hiring rose to over half a million by May of the census year and these jobs were shed in June, July, and August.
The establishment survey (which yields payrolls, hours, and average hourly earnings) samples about 142,000 businesses and government agencies. This results in some sampling error in the payroll data (the monthly change in payrolls is reported accurate to ±110,000). In addition, a number of businesses are created and ended each month (some seasonal in nature), and there is job creation and destruction associated with that. According to the BLS, “both the business birth and death portions of total employment are generally significant, but the net contribution is relatively small and stable.” The birth/death model does a yeoman’s job, except at turning points. Job losses during the financial crisis were much more severe in revision than initially reported. The Fed is well aware of this problem and has made some effort to better anticipate job declines. The birth/death model added 274,000 to the unadjusted payroll figure for October (vs. +275,000 in October 2018). That may have exaggerated the October gain in adjusted payrolls. Other labor market data suggest that this is not a turning point, but could be a soft patch).

Private-sector payrolls rose by 131,000 in October, leaving the three-month average at 154,000 (+168,000 accounting for the GM strike). We need less than 100,000 jobs per month to absorb new entrants into the workforce. So, we should be seeing a reduction in labor market slack. The unemployment rate edged up to 3.6% in October, from 3.5% in September, but this was little more than a rounding error (3.56%, vs. 3.52%). The employment/population ratio, while higher, remains below its level before the financial crisis. However, the ratio for prime-age workers is back to where it was. The difference in the e/p ratios reflects lower ratios for teenagers (about 35% in 2007, vs. about 31% now) and young adults (68% then, 65% now). The kids these days! The e/p ratio for those over 55 was around 37.5% before the crisis, vs. the current 39%.
Estimating the amount of slack in the labor market is a challenge for Fed policymakers. In the 1990s, then-Chair Alan Greenspan coined the term “the pool of available workers” (similar to what Karl Marx called “the reserve army of the unemployed”). The “pool” includes those officially
counted as unemployed plus those not officially considered as part of the workforce who would take a job if offered. As the pool of available workers shrinks, wage pressures will build, and some Fed officials believe that these will be passed through to consumer prices. Growth in average hourly earnings has picked up, more so for production workers. However, there is little evidence that this is feeding through significantly to higher consumer price inflation.

As Powell noted in his post-FOMC press conference, “wages have been rising, particularly for lower-paying jobs,” adding that “people who live and work in low- and middle-income communities tell us that many who struggled to find work are now getting opportunities to add new and better chapters to their lives.” For Powell, “this underscores for us the importance of sustaining the expansion so that the strong job market reaches more of those left behind.” At this point, following three rate cuts this year, Fed policymakers believe they have done enough to support the economy in 2020. Time will tell, but that appears to be a fair assessment for now.
Data Recap – The Fed lowered short-term interest rates for the third time this year, as expected, and Chair Powell hinted that this should be it for a while. Real GDP rose a bit more than expected in the advance estimate for 3Q19, reflecting consumer spending strength and ongoing softness in business fixed investment. The October Employment Report was stronger than expected. The ISM Manufacturing Index remained in contraction, but was not as bad as feared. Investors were encouraged by talk of progress on trade.
The Federal Open Market Committee lowered the federal funds target range by another 25 basis points, the third cut this year, to 1.50-1.75%. There were two dissenting votes in favor of no change. In the policy statement, the FOMC removed the phrase that it would “act as appropriate” to sustain the expansion, replacing that with the notion that it will “assess the appropriate path of the target range for the federal funds rate.”
In his post-FOMC press conference, Fed Chair Powell said that “the policy adjustments we have made to date will continue to provide significant support for the economy,” adding that “since monetary policy operates with a lag, the full effects of these adjustments on economic growth, the job market, and inflation, will be realized over time.” Hinting that the Fed expects no further cuts, Powell said that “we see the current stance of monetary policy as likely to remain appropriate as long as incoming information about the economy remains broadly consistent with our outlook of moderate economic growth, a strong labor market, and inflation near our symmetric 2% objective – we believe that monetary policy is in a good place to achieve these outcomes.” Of course, “if developments emerge that cause a material reassessment of our outlook, we would respond accordingly– policy is not on a preset course.”
Real GDP rose at a 1.9% annual rate in the advance estimate for 3Q19, up 2.0% from 3Q18. Private Domestic Final Purchases (GDP less government, net exports, and the change in inventories – a better measure of underling domestic demand) rose at a 2.0% annual rate (+2.1% y/y). Consumer spending rose at a 2.9% pace, while business fixed investment fell 3.0% (partly reflecting a contraction in energy exploration and ongoing problems at Boeing). Residential fixed investment rose 5.1%, the first increase since 4Q17. Contrary to expectations, net exports and the change in inventories made only modest subtractions from GDP growth.
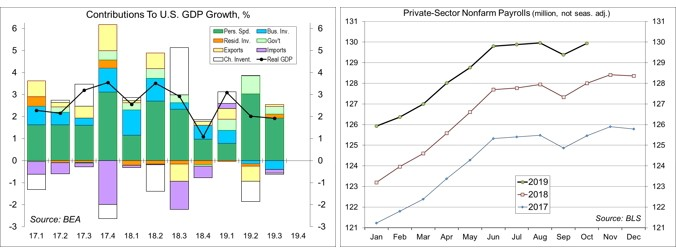
The October Employment Report was stronger than expected. Nonfarm payrolls rose by 128,000 (median forecast: +85,000), held down by the strike at GM (-42,000) and the loss of temporary workers for the 2020 census (-20,000). Payrolls for August and September were revised 95,000 higher. Private-sector payrolls rose by 131,000, a +154,000 average over the last three months (+168,000 excluding the GM strike), well above the pace needed to absorb new entrants into the workforce. Note that the BLS’s birth/death model, which attempts to account for the impact of business creation and destruction on payroll, added 274,000 to unadjusted payrolls (+947,000). The birth/death model does a good job under normal circumstances, but tends to miss at turning points (which you won’t know until after the fact). Average Hourly Earnings rose 0.2% (+3.0% y/ y overall and +3.5% y/y for production workers. The unemployment rate was essentially unchanged at 3.6%, vs. 3.5% in September (a 50-year low).
The ISM Manufacturing Index edged up to 48.3 in October, vs. 47.8 in September and 49.1 in August – still in contraction territory, but not as bad as feared. New orders, production, and employment remained below the breakeven level (50). Comments from supply managers were downbeat.

Personal Income rose 0.3% in September (+4.9% y/y), with aggregate wages and salaries unchanged (+5.2% y/y). Aggregate manufacturing wages & salaries fell 0.2% (+3.8% y/y). Farm income rose 26.7% (reported at an annual rate, +321.8% y/y), reflecting subsidies. Interest income rose 1.1% (vs. -1.1% in August, +0.5% y/y), while dividend income rose 0.5% (+3.7% y/y). Personal Spending rose 0.2% (+3.9% y/y), also up 0.2% (+2.6% y/y) adjusted for inflation. The PCE Price Index was unchanged overall (+1.3% y/y) and excluding food & energy (+1.7% y/y, vs. the Fed’s goal of 2%).
The Employment Cost Index rose 0.7% in the three months ending in September, up 2.8% y/y (the same as the 12 months ending September 2018). Wages and salaries rose 0.9% (+2.9% y/y), while benefits rose 0.6% (+2.3% y/y). The ECI for private-sector workers rose 0.8% over the three months ending in September, up 2.7% y/y (vs. +2.9% for the 12 months ending September 2018).
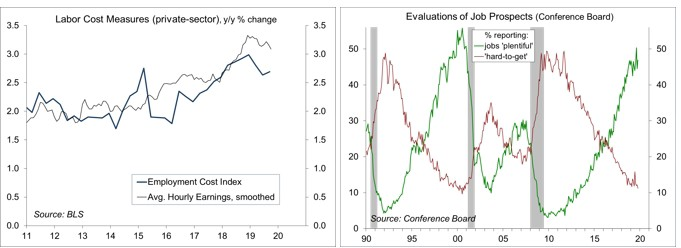
The Conference Board’s Consumer Confidence Index was little changed at 125.9 in the initial estimate for October (vs. 126.3 in September and 134.2 in August. Evaluations of current conditions improved, but expectations slipped, reflecting concerns about future business conditions and job prospects.
The ADP Estimate of private-sector payrolls rose by 125,000 in the initial estimate for October, vs. a 93,000 gain in September (revised from +135,000). The pace of job growth has slowed this year, but remains mixed, with weakness in manufacturing and at small firms, but better gains in healthcare (driven by the demographics) and mid-sized firms.
The Challenger Job-Cut Report showed that announced layoff intentions totaled 50,275 in October, vs. 41,557 in September and 75,644 a year ago (these data are not seasonally adjusted). The total for the first 10 months of 2019 was 16.6% higher than the same period in 2018. The monthly figures were lower than a year ago in both September and October, but the total for the first eight months of the year were up 36.2% y/y.
The Chicago Business Barometer fell to 43.2 in October (vs. 47.1 in September) – the lowest since December 2015. New orders declined to 37.0, the lowest since March 2009. Order backlogs dropped 13.6 points, to 33.1. Production rose to 46.8, still in contraction. Price pressures generally moderated, despite some upward pressure from tariffs.
The Pending Home Sales Index rose 1.5% in September (+3.9% y/y) mixed across regions.
The Chicago Fed National Activity Index fell to -0.45 in September, vs. +0.15 in August, leaving the three-month average at -0.24, consistent with below-trend growth in the near term.
The Bank of Canada left short-term interest rates unchanged, but noted that “growth in Canada is expected to slow in the second half of this year to a rate below its potential.” In considering the appropriate path for monetary policy, “the Bank will be monitoring the extent to which the global slowdown spreads beyond manufacturing and investment.” The BOC said that “it will pay close attention to the sources of resilience in the Canadian economy – notably consumer spending and housing activity – as well as to fiscal policy developments.” (M19-2808845)
The opinions offered by Dr. Brown should be considered a part of your overall decision-making process. For more information about this report – to discuss how this outlook may affect your personal situation and/or to learn how this insight may be incorporated into your investment strategy – please contact your financial advisor or use the convenient Office Locator to find our office(s) nearest you today.
All expressions of opinion reflect the judgment of the Research Department of Raymond James & Associates (RJA) at this date and are subject to change. Information has been obtained from sources considered reliable, but we do not guarantee that the foregoing report is accurate or complete. Other departments of RJA may have information which is not available to the Research Department about companies mentioned in this report. RJA or its affiliates may execute transactions in the securities mentioned in this report which may not be consistent with the report’s conclusions. RJA may perform investment banking or other services for, or solicit investment banking business from, any company mentioned in this report. For institutional clients of the European Economic Area (EEA): This document (and any attachments or exhibits hereto) is intended only for EEA Institutional Clients or others to whom it may lawfully be submitted. There is no assurance that any of the trends mentioned will continue in the future. Past performance is not indicative of future results.