
The Pause That Refreshes?
Chief Economist Scott Brown discusses current economic conditions.
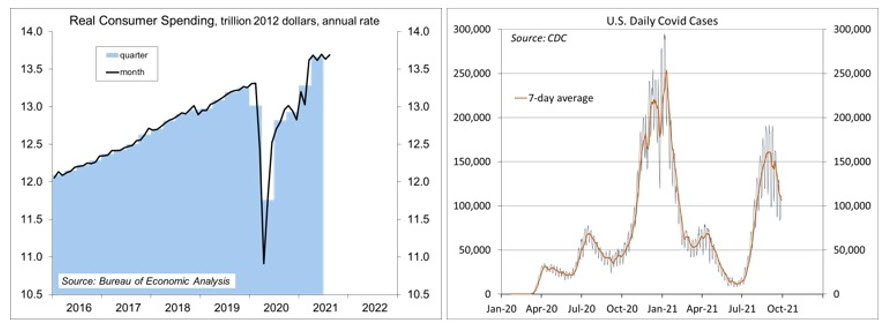
The monthly report on personal income and spending generally doesn’t get a lot of attention from financial market participants. The employment report, released weeks earlier, gives us a good idea of income. The retail sales report points the way on consumer spending. However, it’s important to note that the monthly spending numbers are the same figures that are in the quarterly GDP report. The data for the first two months of the quarter show a sharply lower pace of consumer spending growth. The consumer spending slowdown reflects two factors: the semiconductor shortage and the Delta variant, neither of which will last indefinitely.
Nominal (current dollar) consumer spending rose 0.8% in August – sounds good – but that followed a 0.1% dip in July (revised from +0.3%). Real (constant dollar) spending rose 0.4%, following a 0.5% decline, tracking at about a 0.5% annual rate in 3Q21 (vs. +11.4% in 1Q21 and +12.0% in 2Q21). Motor vehicle sales fell 6.3% in August (-6.8% adjusting for inflation, down 21.1% from April (-27.5% adjusting for inflation). Reports from automakers indicate that unit sales fell further in September. The drop in vehicle sales does not reflect weak demand. Rather, production of new vehicles has been curtailed by the semiconductor shortage. The weekly jobless claims report noted some increase in layoffs in the auto industry. Auto retailers are normally trying to clear lots during this time of year to make way for the newer models, but inventories are thin. The lack of inventory means that sales are likely to be pushed out, but the semiconductor shortage is expected to last into next year. So it could be a while.
The 3Q21 moderation in spending growth was not entirely due to a lack of motor vehicles. Spending on services slowed. Consumer attitude measures weakened in September. The Delta surge appears to have interrupted the recovery in air travel and tourism. COVID booster shots could help to shore up confidence among older consumers.
It’s not unusual for consumer spending growth to be uneven across quarters, but the recovery from the pandemic (which isn’t over yet) and the shift in spending patterns (more goods, less services) add uncertainty. The last time we saw a moderation in spending growth was in the fourth quarter of last year. That moderation coincided with a surge in COVID cases. The 3Q21 slowdown in spending is coincident with the surge in the Delta variant. Consumer spending accelerated in the first half of this year as the COVID wave subsided. Might it accelerate again as the Delta wave recedes?
Federal Reserve policymakers should look beyond near-term disruptions to the recovery, but there is an elevated level of uncertainty in the economic outlook. In tapering the monthly pace of asset purchases (expected to be announced at the November 2-3 FOMC meeting), monetary policy would still be very accommodative, but far from “tight.” The bigger dilemma would be if inflation pressures continue to linger and supply constraints continue to dampen the pace of growth. That’s not exactly “stagflation,” but it’s not what we had hoped for.
Recent Economic Data
Real GDP rose at a 6.7% annual rate in the 3rd estimate for 2Q21 (vs. +6.6% in the 2nd estimate).
The ISM Manufacturing Index edged up to 61.1 in September, vs. 59.9 in August and 59.5 in July. The report showed continued strength in new orders and production, but continued strains in supply chains.
The PCE Price Index rose 0.4% in August (+4.3% y/y), up 0.3% (+3.6% y/y) ex-food & energy. The Dallas Fed’s Trimmed-Mean PCE Price Index, which discards the highest and lowest inflation components, rose 0.2% (+2.0% y/y, suggesting that the higher inflation in the PCE Price Index is not broad-based).
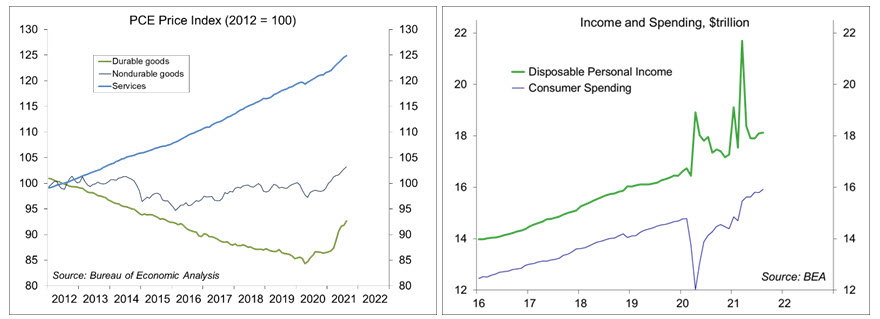
Personal income rose 0.2% in the initial estimate for August (+6.1% y/y), led by a 0.5% gain in private-sector wages and salaries (+10.8% y/y). Personal spending rose 0.8% (+11.6% y/y), up 0.4% (+7.0% y/y) adjusting for inflation. Real personal spending (69% of GDP) is tracking at a 0.5% annual rate in 3Q21 (vs. 11.4% in 1Q21 and +12.0% in 2Q21).
Durable goods orders rose 1.8% in the initial estimate for August, reflecting a 77.9% surge in civilian aircraft orders (which tend to be volatile). Ex-transportation, orders rose 0.2%. Orders for nondefense capital goods ex-aircraft rose 0.5%, while shipments rose 0.7%.
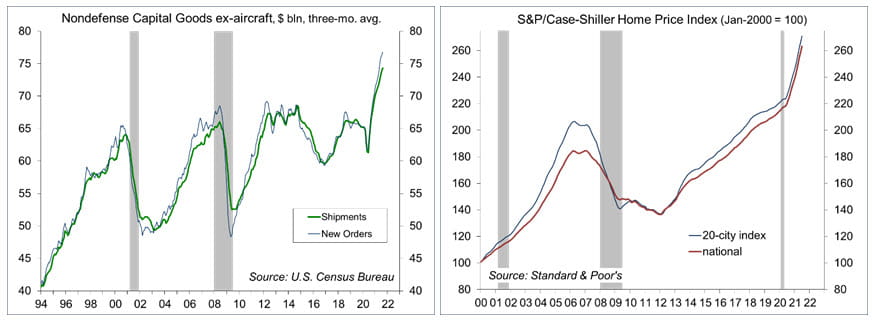
The Case-Shiller Home Price Index rose 19.7% y/y in August, up 25.0% since the end of 2019.
The Pending Home Sales Index rose 8.1% in August (-8.3% y/y), up 1.4% before seasonal adjustment.
Gauging the Recovery
The New York Fed’s Weekly Economic Index fell to +7.58% for the week ending September 25, vs. +8.10% a week earlier (revised from +7.64%). The WEI is scaled to y/y GDP growth (- 2.9% y/y in 3Q20). A year ago, the index stood at -4.73%.
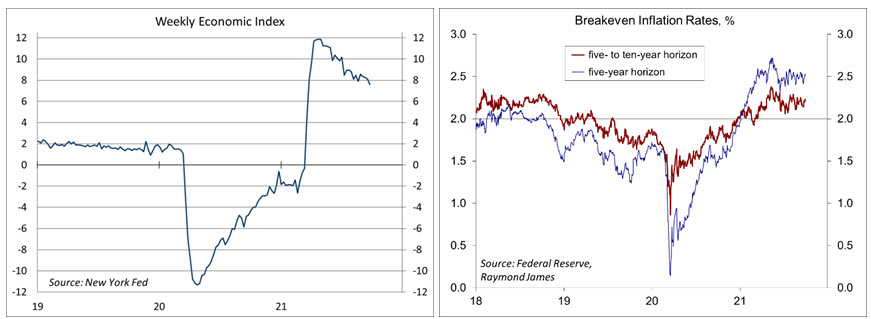
Breakeven inflation rates (the spread between inflation-adjusted and fixed-rate Treasuries, not quite the same as inflation expectations, but close enough) continue to suggest a moderately higher near-term inflation outlook. The 5- to 10-year outlook remains consistent with the Fed’s long-term goal of 2%.
Jobless claims rose by 11,000, to 362,000 in the week ending September 25, reflecting another large increase (+18,000) in claims in California. The end of extended benefits (Labor Day) led to a sharp drop in total claimants in the week ending September 11 (to 5.0 million, from 11.3 million).
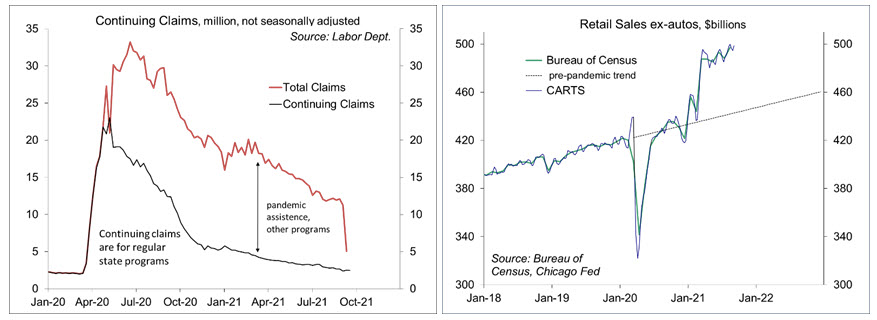
Chicago Fed Advance Retail Trade Summary (CARTS): the Weekly Index of Retail Trade increased 0.8% on a seasonally adjusted basis after decreasing 0.3% in the previous week. September retail sales (ex-autos) were projected to rise 0.6% from August.
The University of Michigan’s Consumer Sentiment Index edged up to 72.8 in the full-month assessment for September (the survey covered August 25 to September 27), vs. 71.0 at mid-month and 70.3 in July. The report noted a “depressed optimism” sparked by the Delta variant. Inflation psychology does not appear rooted, but consumers generally expect reduced income gains after adjusting for inflation.
The opinions offered by Dr. Brown are provided as of the date above and subject to change. For more information about this report – to discuss how this outlook may affect your personal situation and/or to learn how this insight may be incorporated into your investment strategy – please contact your financial advisor or use the convenient Office Locator to find our office(s) nearest you today.
This material is being provided for informational purposes only. Any information should not be deemed a recommendation to buy, hold or sell any security. Certain information has been obtained from third-party sources we consider reliable, but we do not guarantee that such information is accurate or complete. This report is not a complete description of the securities, markets, or developments referred to in this material and does not include all available data necessary for making an investment decision. Prior to making an investment decision, please consult with your financial advisor about your individual situation. Investing involves risk and you may incur a profit or loss regardless of strategy selected. There is no guarantee that the statements, opinions or forecasts provided herein will prove to be correct.