Trade Policy, the Yield Curve, and the Global Economy
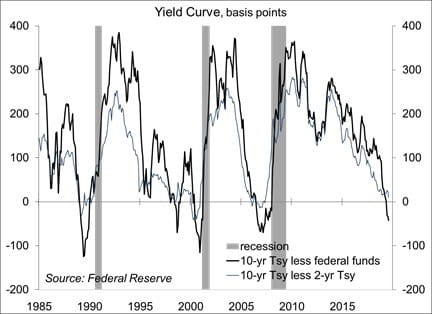
It was a roller coaster week for the financial markets. President Trump postponed to December 15 about 60% of the tariff increases that has been set for September 1, presumably to save Christmas (the list of delayed items included things likely to be purchased during the holiday shopping season). The 10-year Treasury note yield fell below the 2-year note yield, leading to media frenzy on “a flashing recession indicator.” However, there’s nothing magical about a 10-year/2-year inversion. The flattening of the yields curve has already coincided with an increased chance of entering a recession within the next 12 months. The economic data have been mixed, reflecting continued strength in consumer spending, but moderate weakness in manufacturing. The global economic data have generally been awful, but investors are hopeful that we’ll see monetary policy stimulus. All of this comes as Fed Chairman Powell heads to Jackson Hole to talk about “Challenges for Monetary Policy.”
The slope of the yield curve, the difference between long- and short-term interest rates is the single best predictor of recessions. An inverted curve signals trouble ahead, although it may take some time before a recession starts. The debate here is not whether the economy is in a recession – it’s not. The concern is whether the economy will contract in the months ahead. The spread between the 10-year Treasury note and the 3-month bill rate implies nearly a 40% chance of a recession within the next 12 months.
How might this come about? Consumer spending accounts for 68% of Gross Domestic Product and the household fundamentals are in good shape. Job growth has slowed this year, but the trend remains well beyond a pace needed to absorb new entrants into the workforce. Nonresidential fixed investment, 13.6% of GDP in 2Q19, is a different story, down at a 0.6% annual rate (inflation-adjusted). Some of that weakness reflected a decrease in energy exploration and problems at Boeing, both of which should be transitory.
Manufacturing activity has weakened this year. Factory output fell 1.6% from December to July. U.S. firms get parts and supplies from around the world. Tariffs have raised costs and disrupted supply chains. There is some wiggle room in the distribution chain to absorb higher costs, but profit margins in manufacturing are generally low and the May 10 increase in tariffs (from 10% to 25%) was a bigger problem.
The tariffs (10% on the remaining $300 billion in Chinese goods) that were set to start on September 1 fall mainly on consumer goods. U.S. retailers need to import these goods in the next couple of months for the holiday shopping season. The decision to delay the tariffs on consumer goods is an implicit acknowledgement that tariffs are damaging to the U.S. economy.
Tariffs are a drag on the U.S. economy, but not a huge drag, at least not directly. However, trade policy also affects the economy through the uncertainty channel. Uncertainty is a negative factor for business investment. Recession fears are also an issue, as expectations of a downturn
can be self-fulfilling. Hence, the outlook is cautious. As firms become more concerned about the future, they will likely delay hiring plans and may start to lay off workers. The Challenger Job-Cut report showed a 36% increase in announced corporate layoff intentions in the first seven months of this year. The level is still very low, but the increase could be an early indication of a softening in labor market conditions. Investors should closely monitor the labor market data over the next several months.
In lowering short-term interest rates on July 31, Fed Chair Powell cited three factors: 1) the impact of trade policy uncertainty and slower global growth on the U.S. economy; 2) the downside risks these factors pose; and 3) the low trend in inflation. Trade policy uncertainty has increased. Recent global economic data have been poor. However, investors are hopeful that policy efforts abroad will limit the damage and right the ship.
The theme of this year’s monetary policy symposium put on by the Kansas City Fed in Jackson Hole Wyoming is timely. The focus is on international issues, how financial markets, trade, and economic activity are affected as central banks undertake divergent policy paths (such as the Fed tightening, while policy remains easy abroad). This should dovetail nicely into the Fed’s decision process for September 18 (the date of the next FOMC policy announcement) and beyond.
Data Recap – The economic data reports were mixed, but financial market participants were whipsawed by trade policy developments, fears of recession, and hope for stimulus abroad. Retail sales were stronger than expected, while manufacturing output weakened. President Trump delayed some of the tariffs on consumer goods from China. The 10-year Treasury note yield and the 2-year note yield briefly inverted, with the financial media fanning fears of recession (though the odds of entering a recession within the next 12 months had been rising as the yield curve flattened). Economic data from the rest of the world was weak, but investors were apparently encouraged by the prospects for monetary policy stimulus by foreign central banks.
President Trump delayed until December 15 about 60% of the tariff increases (10% on the remaining $300 billion in Chinese goods exported to the U.S.) that had been slated to go into effect on September 1. These included items likely to be purchased during the holiday shopping season (including smartphones, smartwatches, laptop computers, video games, and certain items of footwear and clothing).
Import containers into the Port of Long Beach fell 9.9% y/y in July. Export container volumes sank 6.8% y/y.
Retail Sales rose 0.7% in the advance estimate for July (+3.4% y/y), up 1.0% excluding autos (+3.7% y/y). Core retail sales (which exclude autos, building materials, and gasoline) rose 1.0% (median forecast: +0.3%). Department store sales rose 1.2% (-4.7% y/y), while non-store retail sales (including internet shopping) rose 2.8% (+16.0% y/y). Sales at restaurants and bars rose 1.1% (+3.8% y/y).
Industrial Production slipped 0.2% in July (+0.5% y/y), despite a 3.1% weather-related gain in the output of utilities (+0.3% y/y). Mining fell 1.8%,
reflecting disruptions from Hurricane Barry. Oil and gas well drilling fell 3.3% (-6.5% y/y). Energy extraction fell 1.7% (+8.3% y/y). Manufacturing output fell 0.4%, down more than 1.6% since December.
Nonfarm Productivity rose at a 2.3% annual rate in the preliminary estimate for 2Q19 (+1.8% y/y). Unit Labor Costs rose at a 2.4% pace (+2.5% y/y). Manufacturing productivity fell at a 1.6% annual rate (+0.2% y/y), leaving unit labor costs up 5.8% (+4.3% y/y).
The University of Michigan’s Consumer Sentiment Index fell to 92.1 in the mid-August assessment, vs. 98.4 in July. Trade policy increased consumer uncertainty and the Fed’s interest rate cut lifted fears of recession, according to the report. However, consumers remained relatively optimistic about their future financial prospects (that is, not pessimistic).
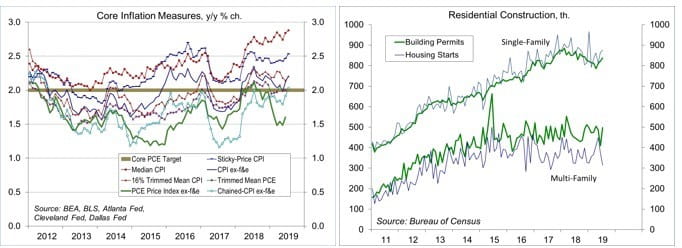
The Consumer Price Index rose 0.3% in July (+1.8% y/y), reflecting a 2.5% increase in gasoline prices (-3.3% y/y). Ex-food & energy, the CPI rose 0.3% (+0.291% before rounding). Note that the Fed uses the PCE Price Index as its official target, which has a smaller weighting on shelter and has been trending about 0.4-0.5 percentage point below the core CPI y/y in recent months.
Real Hourly Earnings edged down 0.1% in July (+1.3% y/y). For production workers, real earnings slipped 0.2% (+1.6% y/y).
Building Permits jumped 8.4% in the initial estimate for August, reflecting a surge in multi-family permits (which tend to be volatile). Single-family permits rose 1.8% (still down 3.8% from a year ago). Unadjusted single-family permits for May-July fell 3.9% y/y (-6.3% in the Northeast, -4.7% in the Midwest, -4.1% in the South, and -2.2% in the West). Housing Starts fell 4.0% (+0.6% y/y), with single-family starts up 1.3% (+1.9% y/y).
Homebuilder Sentiment edged up to 66 in August, vs. 65 in July and 64 in June. The National Association of Home Builders noted continued strong demand for homes, but builders “continue to struggle with rising construction costs stemming from excessive regulations, a chronic shortage of workers and a lack of buildable lots.” The drop in mortgage rates has failed to provide a corresponding boost in activity “because the rate declines occurred due to economic uncertainty stemming largely from growing trade concerns,” according to NAHB.
Import Prices rose 0.2% in the initial estimate for July (-1.8% y/y), unchanged ex-food & fuels (-1.5% y/y). These figures do not include import duties (tariffs). Ex-fuels, the price index of imported industrial supplies and materials rose 0.2% (-3.8% y/y). Prices of imported capital goods fell 0.1% (-1.3% y/y). Prices of imported autos and parts slipped 0.3% (-0.8% y/y). Prices of imported consumer goods ex-autos rose 0.2% (-0.6% y/y).
The Index of Small Business Optimism edged up to 104.7 in July, vs. 103.3 in June and 105.0 in May, which make one wonder who they are interviewing.
Treasury reported a $119.7 billion Budget Deficit for July, a 26.7% increase for the first 10 months of the fiscal year. The deficit over the last 12 months was about 4.5% of GDP (vs. 3.1% in January 2017).
The opinions offered by Dr. Brown should be considered a part of your overall decision-making process. For more information about this report – to discuss how this outlook may affect your personal situation and/or to learn how this insight may be incorporated into your investment strategy – please contact your financial advisor or use the convenient Office Locator to find our office(s) nearest you today.
All expressions of opinion reflect the judgment of the Research Department of Raymond James & Associates (RJA) at this date and are subject to change. Information has been obtained from sources considered reliable, but we do not guarantee that the foregoing report is accurate or complete. Other departments of RJA may have information which is not available to the Research Department about companies mentioned in this report. RJA or its affiliates may execute transactions in the securities mentioned in this report which may not be consistent with the report’s conclusions. RJA may perform investment banking or other services for, or solicit investment banking business from, any company mentioned in this report. For institutional clients of the European Economic Area (EEA): This document (and any attachments or exhibits hereto) is intended only for EEA Institutional Clients or others to whom it may lawfully be submitted. There is no assurance that any of the trends mentioned will continue in the future. Past performance is not indicative of future results.


