
Trade, the Dollar, and Inflation
Chief Economist Scott Brown discusses current economic conditions.
The advance estimate of 1Q21 GDP growth is expected to show negative contributions from net exports and the change in inventories. Private Domestic Final Purchases (consumer spending, business fixed, investment, residential fixed investment), a better measure of underlying domestic demand, should be a lot stronger. All else equal, a wider trade deficit puts downward pressure on the dollar, but while the trade-weighted dollar has risen relative to the end of last year, and by itself is not a significant issue in the inflation outlook. Prices of raw materials have risen, but that is likely to be transitory. Inflation in finished imported goods has remained moderate.
In the shutdowns last spring, the trade deficit rose sharply. Imports fell, but exports fell more. In the initial recovery, imports rebounded more sharply than exports, further widening the deficit. The faster arrival of vaccines and more massive fiscal stimulus have fueled expectations of even stronger growth in the U.S. The recovery in the rest of the world should be mixed. So the trade deficit is unlikely to fall significantly anytime soon. Note that weather disruptions likely had a temporary impact on the trade figures in February (restraining U.S. exports).
The dollar surged in the last year’s shutdowns. In a global crisis, there is often a flight to safety. However, if the crisis is global in natures (that is, everywhere and not limited to one specific region), capital tends to return home. That may have been a factor in the dollar weakening past the initial shutdown through the end of last year. Still, the trade-weighted dollar fell only 2.7% from the end of 2019 to the end of 2020. Since the end of last year, the dollar has improved.
The dollar can be thought of as a price, dependent on supply and demand. In the U.S., there are large trade flows and large capital flows into and out of the country. We have a net trade deficit and a net capital surplus, and the dollar moves to balance those over time. Hence, without a corresponding increase in net capital flows, a wider trade deficit puts downward pressure on the dollar. Still, last year’s decline in the dollar was not especially steep.
Monetary and fiscal policy also play a role in exchange rates, since they can influence capital flows. Tighter monetary policy is a positive for the dollar in the short run, while looser policy is a negative. However, it’s all relative. If other central banks are conducting easier policy, there may be no currency pressure from easy Fed policy. Remember also that the Fed does not set the exchange rate of the dollar. That falls under the Treasury’s jurisdiction. Still, there’s not much the fiscal authority can do to push exchange rates one way or another. Intervention in the currency markets is only a short-term fix. Still, aggressive monetary and fiscal policy may be a concern to overseas investors. We went through this in the aftermath of the financial crisis.
Exchange rates are not a major factor in the inflation outlook. Prices of raw materials have risen, in many cases sharply, but that has more to do with supply chain issues as the economy re-opens. Moreover, inflation in imported finished goods has remained moderate. This has long been an issue for U.S. manufacturers: higher input costs but a limited ability to raise prices of finished goods. In response, the manufacturing sector has relied increasingly on automation to boost productivity.
China’s rise in global trade had a significant impact on U.S. manufacturing. Between 2000 and 2010, the U.S. lost about two million manufacturing jobs (much less since), with a devastating impact at the community level. However, the U.S. has a big economy. During that decade we averaged about two million layoffs each quarter (all industries). In the aggregate, the impact of Chinese trade on U.S. employment was small. Increased trade with China did reduce inflation pressures, allowing U.S. consumers to stretch their dollars farther. This is the nature of trade. There are winners and losers, but in the aggregate, both countries are better off.
On Wednesday evening, President Biden will lay out his spending priorities for the next few years. Economists generally believe that many of these provisions would boost the economy’s long-term growth potential. However, there is the issue of how to pay for it and investors will focus on higher taxes, especially the corporate tax rate. Recall that the Tax Cut and Jobs Act of 2017 (TCJA) lowered the corporate tax rate from a tiered rate ranging from 15% to 39%, to a flat rate of 21%. Previous economic research had suggest that such a cut would more likely lead to increased dividends and share buybacks rather than increased business investment – and that played out largely as anticipated. About 35% of U.S. stocks are owned by foreigners. They got a sizable tax break too.
Recent Economic Data
The Chicago Fed National Activity Index, a composite of 85 economic indicators, rebounded in March (from February’s poor weather). At 0.54, the three-month average was consistent with strong growth.
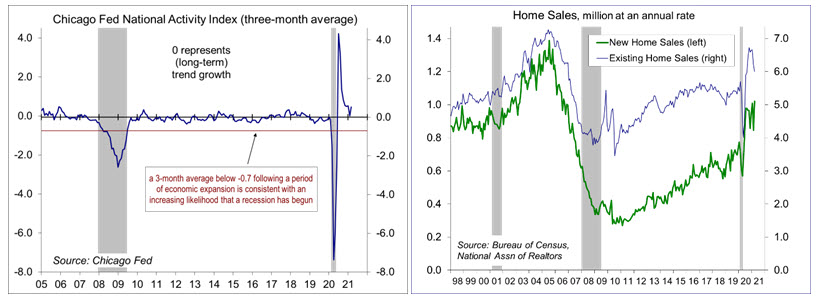
Existing home sales failed to rebound as expected in March, falling another 3.7% (following a 6.3% decline in February), to a 6.01 million seasonally adjusted annual rate (note that sales rose 32.2% before seasonal adjustment), up 12.3% year-over-year. The National Association of Realtors noted that demand remained strong (despite a further decrease in affordability), but the limited number of homes for sale remained the major constraint. Sales were lower in all four regions.
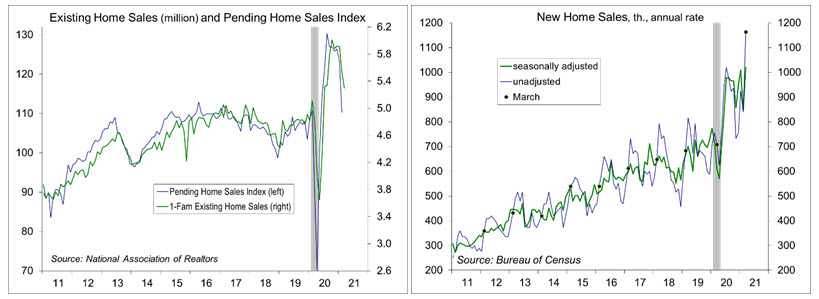
New home sales jumped 20.7% in March, to a 1.021 million seasonally adjusted annual rate (+66.8% y/y). The three previous months were revised higher.
The Conference Board’s Index of Leading Economic Indicators rose 1.3% in March, partly reflecting a rebound from February’s bad weather, with all ten components making positive contributions.
Gauging the Recovery
The New York Fed’s Weekly Economic Index rose to +12.27% for the week ending April 17, up from +11.81% a week earlier (revised from +11.74%), signifying strength relative to the weak data of a year ago. The WEI is scaled to year-over-year GDP growth.
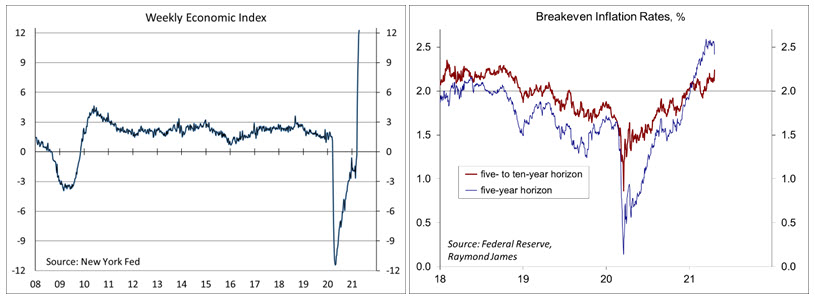
Breakeven inflation rates (the difference between inflation-adjusted and fixed-rate Treasuries) continue to suggest a moderately higher inflation outlook for the next five years, but the outlook five to ten years out remains close to the Fed’s long-term goal of 2% (consistent with the Fed’s revised monetary policy framework).
The trend in COVID-19 cases has continued at a relatively high rate (about the peak of the second wave). Over 550,000 have died from COVID-19 in the U.S.
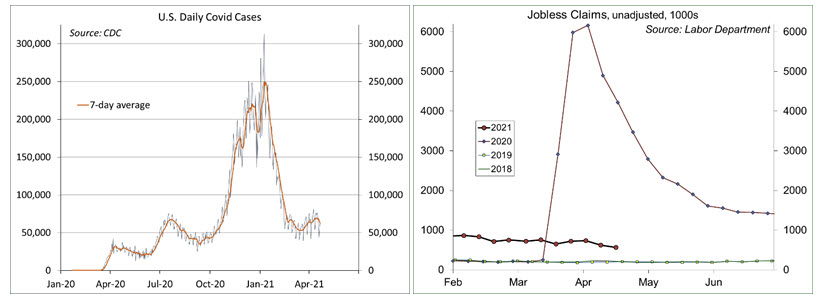
Jobless claims fell by 39,000, to 547,000, in the week ending April 17. The level of claims is trending lower, but is still relatively high. The downtrend should be consistent with strong growth in nonfarm payrolls.
The University of Michigan’s Consumer Sentiment Index rose to 86.5 (a 12-month high) in the mid-month assessment for April (the survey covered March 24 to April 14), vs. 84.9 in March and 76.8 in February. In a typical recovery, expectations outpace evaluations of current conditions, but that’s not happening (expectations were unchanged at 79.7, while evaluations of current conditions rose from 93.0 to 97.2). Near- term inflation expectations have risen, but five-year-ahead expectations remained “well anchored.”
The opinions offered by Dr. Brown are provided as of the date above and subject to change. For more information about this report – to discuss how this outlook may affect your personal situation and/or to learn how this insight may be incorporated into your investment strategy – please contact your financial advisor or use the convenient Office Locator to find our office(s) nearest you today.
This material is being provided for informational purposes only. Any information should not be deemed a recommendation to buy, hold or sell any security. Certain information has been obtained from third-party sources we consider reliable, but we do not guarantee that such information is accurate or complete. This report is not a complete description of the securities, markets, or developments referred to in this material and does not include all available data necessary for making an investment decision. Prior to making an investment decision, please consult with your financial advisor about your individual situation. Investing involves risk and you may incur a profit or loss regardless of strategy selected. There is no guarantee that the statements, opinions or forecasts provided herein will prove to be correct.