
Weekly Economic Commentary
Chief Economist Scott Brown discusses current economic conditions.
Year-over-year inflation remained elevated in July, but the monthly data moderated, providing support to the view that higher inflation will be likely be transitory. Still, it’s only one month and we won’t know for sure until well into 2022. Inflation may end up higher than where it was before the pandemic, but that’s kind of what the Fed is shooting for. Meanwhile, the surge in cases of the delta variant threatens to dampen growth in the near term.
The 2Q21 surge in inflation reflected base effects, restart pressures, and a few anomalies. Inflation was low a year ago – so some of the increase reflects a “catching-up.” These base effects are fading quickly now, and we may see some reverse base effects in the months ahead as elevated prices return to normal. Production bottlenecks and materials shortages occur in every economic recovery, but have been especially pronounced this time due to the strength of the economy in the first half of the year (which was much stronger than the 6.4% average of 1Q21 and 2Q21 GDP would suggest – private domestic final purchases averaged a 10.8% annual rate). In addition, we’re seeing an ongoing shift from services to goods (retail sales remain far above the pre-pandemic trend, services remain below the pre-pandemic trend). Auto production fell during last year’s lock down and there was reduced demand from rental agencies. In turn, fewer vehicles were sent to the used car market this year, just as demand was rising with the re-opening of the economy. However, used car prices edged up just 0.2% in July and appear to have fallen into August. Transportation services (including airfares, care rentals, car insurance, etc.) turned lower in July.
There are still a few questions about wage pressures and whether firms will have the ability to pass higher costs along. It’s also unclear what will happen to rents, a major CPI component, as eviction moratoriums end. Inflation headlines may have given cover to firms wanting to raise prices and there may have been some hoarding of materials to get ahead of expected price increases (making those price increases self-fulfilling). Lumber prices are back down. However, transportation remains an issue and the semiconductor shortage is still having a major impact on motor vehicle production.
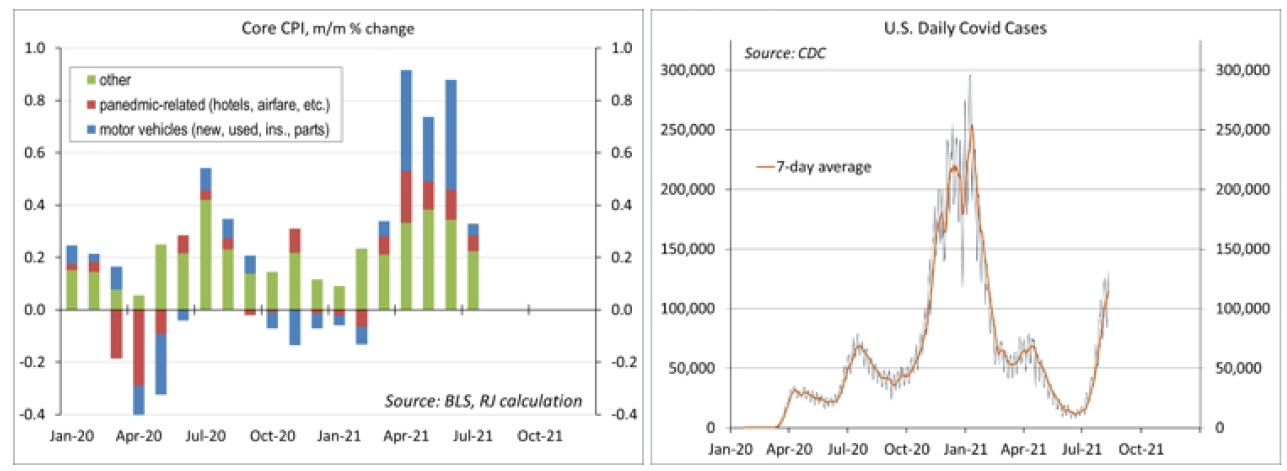
COVID-19 cases are on the rise again, especially in regions with low vaccination rates. The delta variant is much more transmissible, kids are showing more vulnerabilities, and schools are re-opening. What could go wrong? The University of Michigan’s consumer sentiment survey showed a large drop in expectations in the report for mid-August, reflecting the delta surge. Declines were widespread across income, age, and education subgroups and losses covered all aspects of the economy, from personal finances to views on inflation and the national economy. Hopes that the pandemic would soon be over have been dashed.
Hospitals in Texas and Florida are filling up. For the vaccinated, there’s a much smaller chance of hospitalization, but there’s reduced scope for treating other health emergencies due to a lack of beds in intensive care. Vaccination rates have picked up and self-protection should help to reduce cases, but we’re likely to see somewhat slower growth (although still strong) in the near term.
Recent Economic Data
The Consumer Price Index rose 0.5% in July (+5.4% y/y, vs. +1.0% y/y in July 2020), up 0.3% (+4.3% y/y) ex- food & energy. Many of the areas that had experienced rapid inflation in recent months showed signs of moderation. Transportation services fell 1.1% (+6.4% y/y, vs. -3.7% y/y in July 2020). Car and truck rental prices fell 4.6% (+73.5% y/y, vs. -3.4% y/y in July 2020). Motor vehicle insurance fell 2.8% (+1.6% y/y, vs. -1.9% y/y a year ago). Airfares edged down 0.1% (+19.0% y/y, vs. -23.7% y/y a year ago).
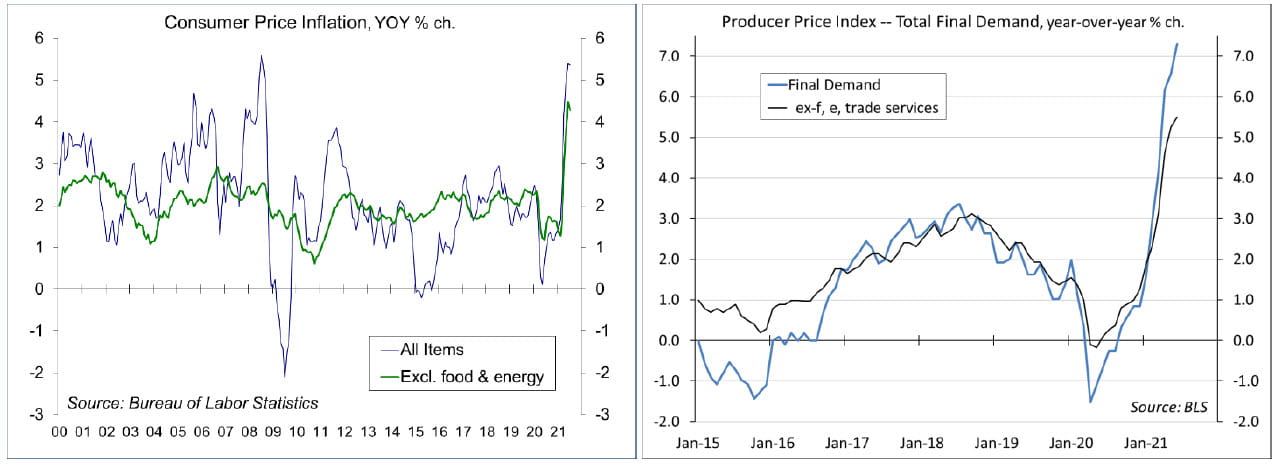
The Producer Price Index rose 0.9% in July (+7.8% y/y), partly reflecting a 17.4% widening in retail margins in autos. Ex-food, energy, and trade services, the PPI rose 0.9% (+6.1% y/y).
Import prices rose 0.3% in July (+10.2% y/y, vs. -0.3% y/y in July 2020), down 0.1% (+6.0% y/y) ex-food & fuels. Non-fuel industrial supplies and materials fell 1.7% (possibly turning the corner, although +29.3% y/y). The price index for imported capital goods and autos picked up (each up 0.4%), but prices of imported consumer goods rose modestly (+0.1% m/m, +1.0% y/y).
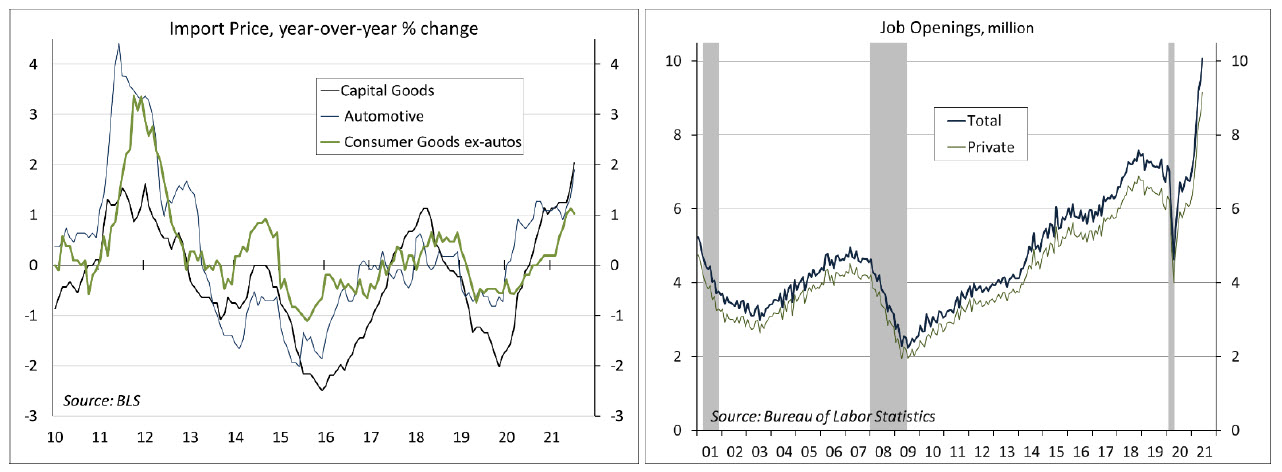
Job openings surged to another record high in June (10.1 million, vs. 9.5 million in May and 6.1 million in June 2020). The quit rate rose to 2.7%, from 2.5% (it hit a record 2.8% in April).
Gauging the Recovery
The New York Fed’s Weekly Economic Index fell to +7.63% for the week ending July 31, vs. +8.83% a week earlier (revised from +8.29%), reflecting decreases in tax withholding, railroad traffic, fuel sales, and electricity output. The WEI is scaled to year-over-year GDP growth (GDP fell 9.1% y/y in 2Q20 and rose 12.2% y/y in 2Q21).
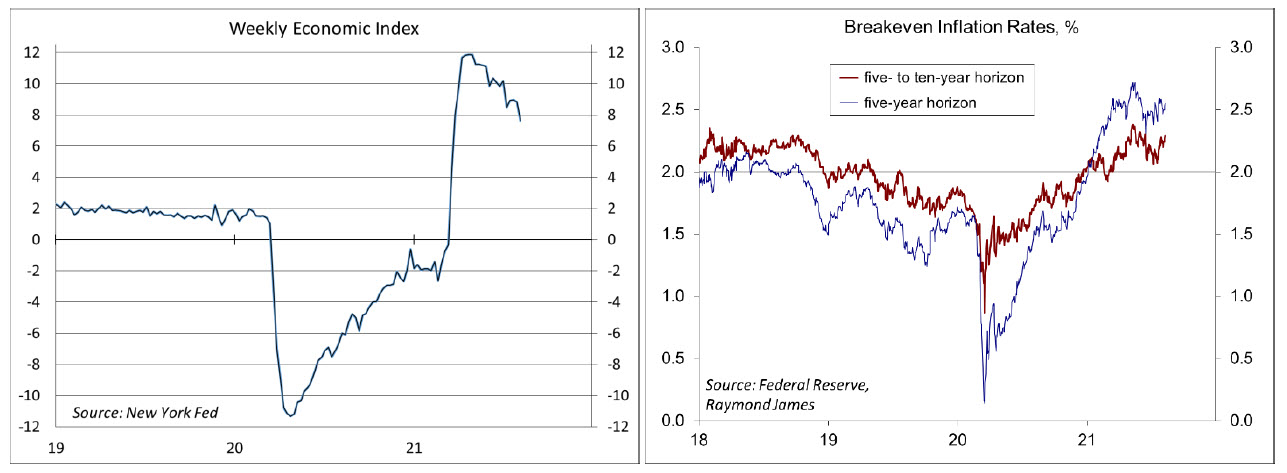
Breakeven inflation rates (the spread between inflation-adjusted and fixed-rate Treasuries, not quite the same as inflation expectations, but close enough) continue to suggest a moderately higher near-term inflation outlook. The 5- to 10-year outlook remains consistent with the Fed’s long-term goal of 2%.
Jobless claims fell by 12,000, to 375,000 in the week ending July 31. Seasonally-adjusted figures have been trending about flat in the last several weeks.
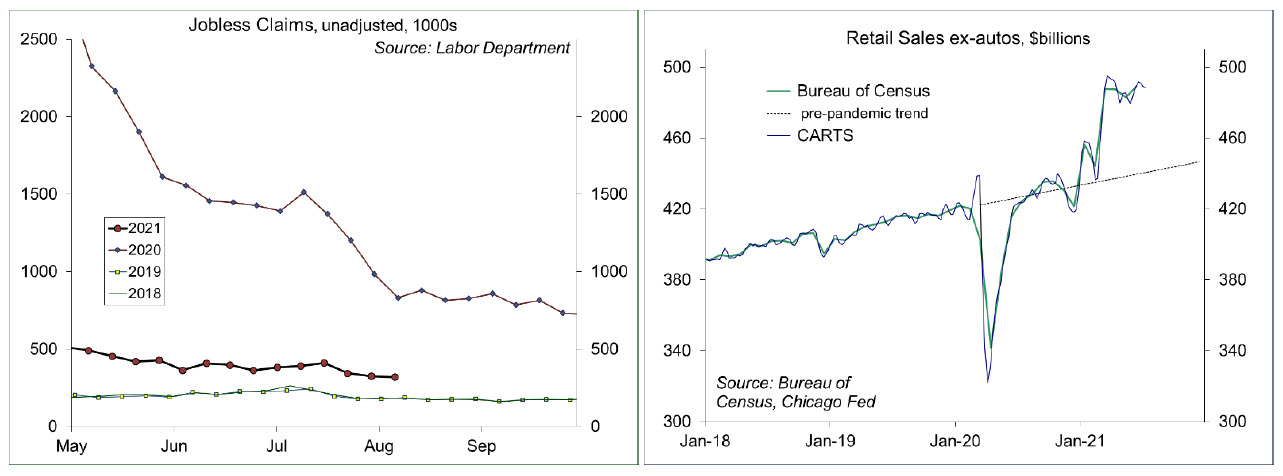
In the fourth week in July, the Chicago Fed Advance Retail Trade Summary (CARTS) index (a composite of multiple retail gauges) showed a 0.6% increase in retail sales (ex-autos), following a 0.9% rise in the previous week. July retail sales (ex-autos) were projected to be up 0.2% from June.
The University of Michigan’s Consumer Sentiment Index fell to 70.2 (below the April 2020 low of 71.8) in the mid-month assessment for August (the survey covered July 28 to August 11), vs. 81.2 in July and 85.5 in June. Expectation sank to 65.2, from 79.0, reflecting concerns about the delta surge.
The opinions offered by Dr. Brown are provided as of the date above and subject to change. For more information about this report – to discuss how this outlook may affect your personal situation and/or to learn how this insight may be incorporated into your investment strategy – please contact your financial advisor or use the convenient Office Locator to find our office(s) nearest you today.
This material is being provided for informational purposes only. Any information should not be deemed a recommendation to buy, hold or sell any security. Certain information has been obtained from third-party sources we consider reliable, but we do not guarantee that such information is accurate or complete. This report is not a complete description of the securities, markets, or developments referred to in this material and does not include all available data necessary for making an investment decision. Prior to making an investment decision, please consult with your financial advisor about your individual situation. Investing involves risk and you may incur a profit or loss regardless of strategy selected. There is no guarantee that the statements, opinions or forecasts provided herein will prove to be correct.