
What Does the 1Q21 Data Tell Us About the Rest of the Year?
The Bureau of Economic Analysis reported that Gross Domestic Product (GDP) rose at a 6.4% annual rate in the advance estimate for the first quarter. However, that understates the economy’s strength. Private Domestic Final Purchases, a better measure of underlying domestic demand, rose at a 10.6% pace. Looking at the various components tells a story, one that ought to lead to reversals in some areas and strength in others. While many have obsessed about temporary inflation pressures from tight supply chains, the amount of slack in the labor market is potentially a bigger concern to the outlooks for growth and inflation.
As expected, first quarter GDP growth was held back by slower inventory growth (which subtracted 2.8 percentage points from headline GDP growth) and a wider trade deficit (-0.9 percentage point). Federal checks and deposits to households boosted personal income by 21.1% in March, which helped to fuel a 10.8% increase in spending on consumer durable goods (goods meant to last more than three years – autos, furniture, sporting equipment, etc.). Consumer spending on services rose 2.2%, normally a strong gain, but still leaving us far short of pre-pandemic levels.

Stimulus checks and deposits are now behind us. While there should still be some lagged support for spending, the impact should fade over time. However, part of the strength in spending on durable goods was the result of an inability to spend on other areas. Spending on consumer services should continue to rebound, but more rapidly as the economy more fully opens and the pandemic fades. We can expect a moderation, even some decline, in spending on durables as spending on services takes off. Note that spending on services is much larger than spending on durables, so overall consumer spending growth should be strong.
Inventories fell (a -$85.5 billion seasonally adjusted annual rate in 2012 dollars), although most of that was in retail autos (-$74.1 billion). Auto production has been restrained by a semiconductor shortage. This may add to temporary inflation pressures.
Commodity price inflation is not the same as consumer price inflation. Part of the increase in prices of raw materials is due to the fear that prices will rise, which leads to stockpiling ahead of an expected price increase, and no surprise, higher prices. Supply chain issues typically resolve themselves over time, but that could take a bit longer in the current environment.
The labor market is the widest channel for inflation pressures. Average hourly earnings have been distorted by compositional changes (a sharp decline and partial rebound in lower-paying jobs in the service industry and within other industries). The Employment Cost Index, which does not suffer from these compositional issues, rose more than expected (+0.9%) over the three months ending in March, but remained moderate year- over-year (+2.6%). Still, we may not have as much slack in the labor market as is currently believed and it could be difficult to match unemployed workers to available jobs, which may add to labor cost pressures over the next several months.
Recent Economic Data
The Federal Open Market Committee left short-term interest rates unchanged (federal funds target range at 0-0.25%) and did not alter the monthly pace of asset purchases ($120 billion per month). The policy statement was close to the one following the mid-March meeting, although the FOMC recognized that “indicators of economic activity have strengthened,” and that “inflation has risen, largely reflecting transitory factors.” In his press conference, Chair Powell said that it was too soon to even talk about reducing asset purchases.
Real GDP rose at a 6.4% annual rate in the advance estimate for 1Q21, held back by slower inventory growth and a wider trade deficit, still down 0.9% from the fourth quarter of 2019. Private Domestic Final Purchases (PDFP) rose at a 10.6% pace (now 0.8% above 4Q21). PDFP is GDP less next exports and the change in inventories, or equivalently is made up of consumer spending (+10.7%), business fixed investment (+9.9%), and residential fixed investment (+10.8%).
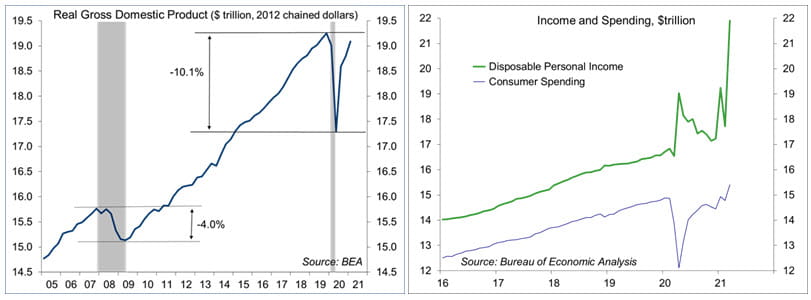
Personal income jumped 21.1% in March (+29.0% y/y), reflecting another round of direct payments to households. Aggregate private-sector wage and salary income rose 1.1% (+5.6% y/y). Personal spending rose 4.2%, reflecting a 10.8% surge in spending on durables (partly a rebound from February’s bad weather) and a moderate 2.2% gain in consumer services.

The PCE Price Index rose 0.5% in March (+2.3% y/y), up 0.4% (+1.8% y/y) ex-food & energy.
The Employment Cost Index measures the change in the cost of labor, free from the influence of employment shifts among occupations and industries (in contrast, average hourly earnings are often distorted by compositional shifts, such as large job losses in lower-paying industries). The ECI rose 0.9% in the three months ending in March, up 2.6% over the last 12 months (vs. +2.8% in the 12 months ending March 2020).

The Conference Board’s Consumer Confidence Index rose to 121.7 in the initial estimate for April, up from 109.0 in March, but still below the pre-pandemic level (132.6 in February 2020). Evaluations of current job conditions improved sharply. In a typical recovery, expectations lead. However, improvement has been more pronounced in evaluations of the present situation (139.6, vs. 110.1 in March and 89.6 in February).
Durable goods orders rose 0.5% in March, held down by a 1.7% drop in transportation orders (motor vehicles +5.5%, civilian aircraft orders -46.9%, defense aircraft -20.2%). Ex-transportation, orders rose 1.6%. Orders for nondefense capital goods ex-aircraft rose 0.9% (following -0.8% in February).
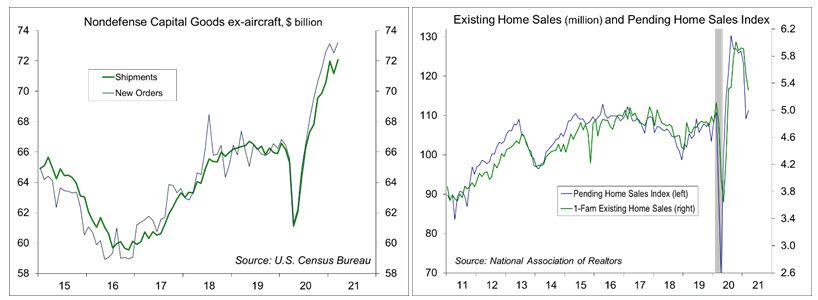
The Pending Home Sales Index rise 1.9% in March, following an 11.5% decline in February (+23.3% y/y). The National Association of Realtors noted continued strong demand, but a limited number of homes for sale.
The Chicago Business Barometer rose to 72.1 in April, the highest since December 1983. The report noted that “firms are overbuying due to raw materials shortages.” Order backlogs soared, up 16.2 points, hitting the highest level since December 1973. Inventories fell 8.7 points. Input price pressures rose further.
Gauging the Recovery
The New York Fed’s Weekly Economic Index rose to +12.27% for the week ending April 17, up from +11.81% a week earlier (revised from +12.27%), signifying strength relative to the weak data of a year ago. The WEI is scaled to year-over-year GDP growth.

Breakeven inflation (the spread between inflation-adjusted and fixed-rate Treasuries) continue to suggest a moderately higher inflation outlook for the next five years. The 5-10-year outlook remains close to the Fed’s long-term goal of 2% (consistent with the Fed’s revised monetary policy framework), but has edged higher.
New cases of COVID-19 cases have begun to trend lower, easing fears about the economy opening up too fast. About 4,300 people died of it last week – trending down, but still too high.

Jobless claims fell by 13,000, to 553,000, in the week ending April 24. The level of claims is trending lower, but is still relatively high. The downtrend should be consistent with strong growth in nonfarm payrolls.
The University of Michigan’s Consumer Sentiment Index rose to 88.3 in the full-month assessment for April (the survey covered March 24 to April 26), vs. 86.5 at mid-month and 84.9 in March. The increase reflected a growing sense that the upward momentum in jobs and incomes will persist. The report noted a record number of respondents expecting lower unemployment over the next 12 months. According to the report, temporary price hikes are anticipated, but there is some concern that this may lead to a longer-term trend of higher inflation.
The opinions offered by Dr. Brown are provided as of the date above and subject to change. For more information about this report – to discuss how this outlook may affect your personal situation and/or to learn how this insight may be incorporated into your investment strategy – please contact your financial advisor or use the convenient Office Locator to find our office(s) nearest you today.
This material is being provided for informational purposes only. Any information should not be deemed a recommendation to buy, hold or sell any security. Certain information has been obtained from third-party sources we consider reliable, but we do not guarantee that such information is accurate or complete. This report is not a complete description of the securities, markets, or developments referred to in this material and does not include all available data necessary for making an investment decision. Prior to making an investment decision, please consult with your financial advisor about your individual situation. Investing involves risk and you may incur a profit or loss regardless of strategy selected. There is no guarantee that the statements, opinions or forecasts provided herein will prove to be correct.